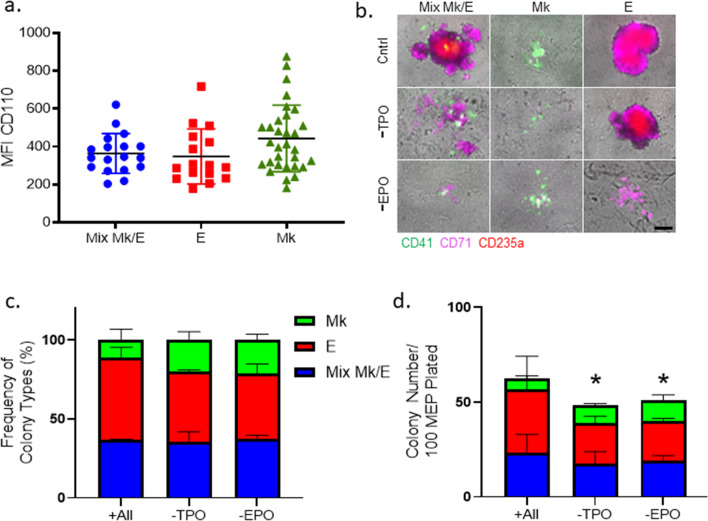
Figure 5.
Thrombopoietin and erythropoietin do not instruct MEP lineage commitment. (a) Index sorting and analysis of TPO receptor, c-Mpl (CD110). MEPs were index sorted into 96-well plates and grown in CFU assay conditions for 14 days. Colony type outcome was correlated with expression of CD110 at the time of sorting/plating. n = 66. Mean and SD indicated. (b) Representative colonies grown from individual MEPs in control, -TPO, and -EPO conditions. Mk/E mix, E-only, and Mk-only colonies were observed in control, -TPO, and -EPO CFU conditions at 14 days. Cells within the colony were stained in situ with CD41 (green), CD71 (magenta), and CD235a (red). Scale bar = 250 μm. (c) Frequency of colony types observed in control, -TPO, and -EPO CFU assays. Colony counts (Mk/E mix in blue, E-only in red, and Mk-only in green) were normalized to total colonies grown in control, -TPO, and -EPO conditions. n = 4. Mean and SD indicated. (d) Colony counts of MEPs grown in control, -TPO, and -EPO CFU assays. Colony counts (Mk/E mix in blue, E-only in red, and Mk-only in green) are reported out of 100 plated MEPs grown in control, -TPO, or -EPO CFU conditions. n = 4, *p < 0.05. Mean and SD indicated.

