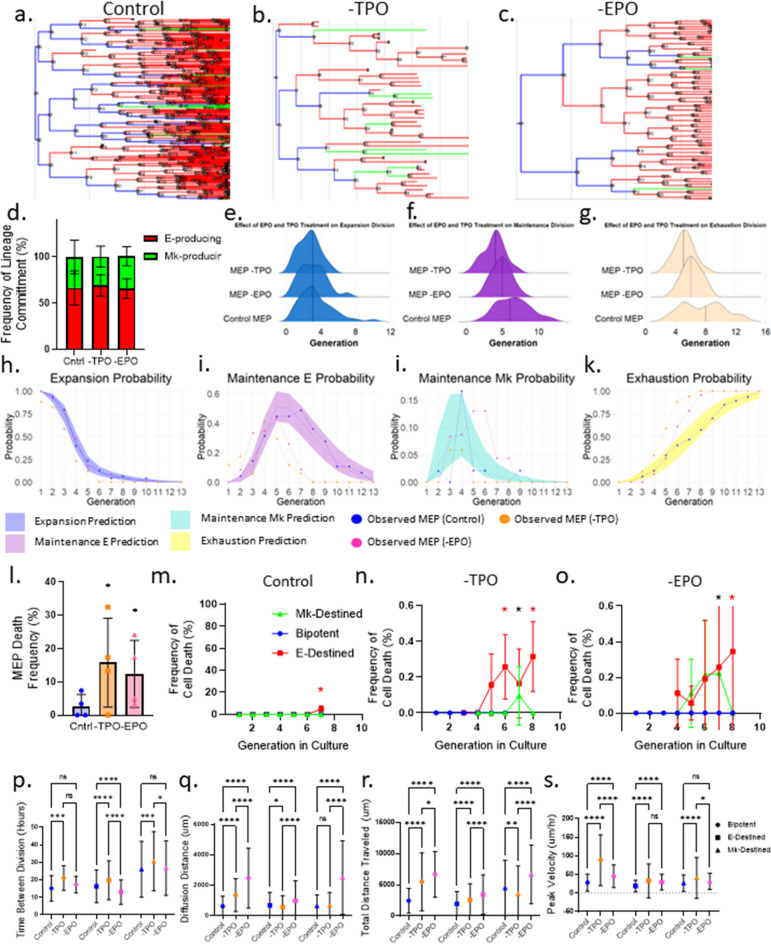
Figure 6.
Thrombopoietin supports MEP self-renewal as well as survival of MEPs and all downstream lineage progenitors. (a) Representative lineage tree of Mk/E mixed colony grown in control conditions. Blue lines represent MEPs, red lines represent E-destined cells, and green lines represent Mk-destined cells. (b) Representative lineage tree of Mk/E mixed colony grown in -TPO conditions. Blue lines represent MEPs, red lines represent E-destined cells, and green lines represent Mk-destined cells. (c) Representative lineage tree of Mk/E mixed colony grown in -EPO conditions. Blue lines represent MEPs, red lines represent E-destined cells, and green lines represent Mk-destined cells. (d) Frequency of MEP lineage commitment. Frequency of lineage commitment was calculated as the number of E- or Mk-destined daughter cells produced by MEPs normalized to 100% in control, -TPO, and -EPO timelapse CFU conditions (n ≥ 3 movies). Mean and SD indicated. (e) Distribution of MEP expansion divisions over time in culture. Distribution of MEP expansion divisions in control, -TPO, or -EPO conditions. The mean is represented by a solid vertical line (n ≥ 3 movies). (f) Distribution of MEP maintenance divisions over time in culture. Distribution of MEP expansion divisions in control, -TPO, or -EPO conditions. The mean is represented by a solid vertical line (n ≥ 3 movies). (g) Distribution of MEP exhaustion divisions over time in culture. Distribution of MEP expansion divisions in control, -TPO, or -EPO conditions. The mean is represented by a solid vertical line (n ≥ 3 movies). (h) Probability of MEP expansion divisions. The probability that MEPs will undergo expansion divisions by generation in culture is represented by the solid line with a 95% confidence interval represented by the colored shadowed region. Actual observed frequency of expansion division outcome by generation is depicted by the dotted line. (i) Probability of MEP maintenance + E divisions. The probability that MEPs will undergo maintenance + E divisions by generation in culture is represented by the solid line with a 95% confidence interval represented by the colored shadowed region. Actual observed frequency of maintenance + E division outcome by generation is depicted by the dotted line. (j) Probability of MEP maintenance + Mk divisions. The probability that MEPs will undergo maintenance + Mk divisions by generation in culture is represented by the solid line with a 95% confidence interval represented by the colored shadowed region. Actual observed frequency of maintenance + Mk division outcome by generation is depicted by the dotted line. (k) Probability of MEP exhaustion divisions. The probability that MEPs will undergo exhaustion divisions by generation in culture is represented by the solid line with a 95% confidence interval represented by the colored shadowed region. Actual observed frequency of exhaustion division outcome by generation is depicted by the dotted line. (l) Frequency of MEP death in control, -TPO, and -EPO CFU conditions. MEP death frequency was calculated as the number of MEPs that failed to give rise to a colony as observed in time-lapse acquisitions normalized to the total number of imaged MEPs for control, -TPO, and -EPO conditions (n ≥ 3, *p < 0.05). Mean and SD indicated. (m) Cell death rate by cell state in control culture conditions. Blue points represent bipotent cells. Red points represent E-destined cells (*p < 0.05). Green points represent Mk-destined cells (n = 6 movies). Mean and SD indicated. (n) Cell death rate by cell state in -TPO culture conditions. Blue points represent bipotent cells. Red points represent E-destined cells (*p < 0.05). Green points represent Mk-destined cells (*p < 0.05, n = 4 movies). Mean and SD indicated. (o) Cell death rate by cell state in -EPO culture conditions. Blue points represent bipotent cells. Red points represent E-destined cells (*p < 0.05). Green points represent Mk-destined cells (*p < 0.05, n = 3 movies). Mean and SD indicated. (p) Lifespan of cell states by culture condition. Lifespan of cells categorized by state as defined in the time-lapse CFU assays was measured by time between divisions in hours of bipotent MEP (circles), E-destined (squares), Mk-destined (triangles), in control (blue), -TPO (orange), and -EPO (pink) conditions. (*p < 0.05, **p < 0.01, ***p < 0.001, ****p < 0.0001, ns not significant, 55 ≤ n ≤ 2035). Mean and SD indicated. (q) Total distance of cell states by culture condition. Total distance traveled by cells categorized by state as defined in the timelapse CFU assays of bipotent MEP (circles), E-destined (squares), Mk-destined (triangles), in control (blue), -TPO (orange), and -EPO (pink) conditions. n for each condition and cell state is listed below each graph. *p < 0.05, **p < 0.01, ***p < 0.001, ****p < 0.0001, ns not significant, 55 ≤ n ≤ 2035. Mean and SD indicated. (r) Diffusion distance of cell states by culture condition. Diffusion distance of cells categorized by state as defined in the timelapse CFU assays of bipotent MEP (circles), E-destined (squares), Mk-destined (triangles), in control (blue), -TPO (orange), and -EPO (pink) conditions. n for each condition and cell state is listed below each graph. *p < 0.05, **p < 0.01, ***p < 0.001, ****p < 0.0001, ns not significant, 55 ≤ n ≤ 2035. Mean and SD indicated. (s) Peak velocity of cell states by culture condition. Peak velocity of cells categorized by state as defined in the time-lapse CFU assays of bipotent MEP (circles), E-destined (squares), Mk-destined (triangles), in control (blue), -TPO (orange), and -EPO (pink) conditions. n for each condition and cell state is listed below each graph. *p < 0.05, **p < 0.01, ***p < 0.001, ****p < 0.0001, ns not significant 55 ≤ n ≤ 2035. Mean and SD indicated.

