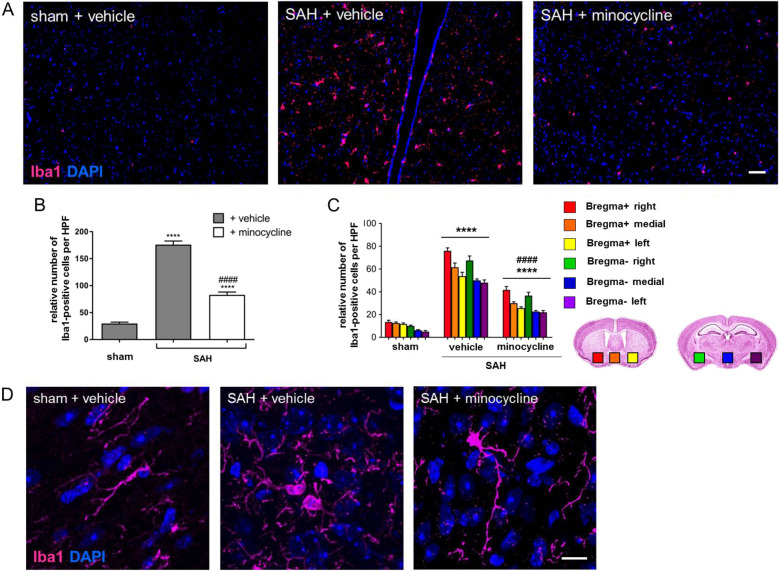
Fig. 2.
Minocycline-mediated effects on microglia/macrophage accumulation and morphology after SAH. Coronal brain sections of minocycline (45 mg/kg) or vehicle-treated mice were stained for Iba1 (magenta) and with DAPI to visualize cell nuclei. a Representative brain sections were processed, and the number of Iba1-positive cells [46] was counted using ImageJ software. Bar indicates 60 µm. Microglia/macrophage accumulation was significantly increased in SAH + vehicle-treated mice compared with sham controls. b Minocycline reduced microglia/macrophage accumulation due to SAH. c A summary of microglia/macrophage distribution in brain areas analyzed with respect to the puncture, ipsilateral, medial, and contralateral site. Coronal brain slices were analyzed in the area of corpus callosum (bregma + ; the brain with red, orange, and yellow squares) and hippocampus (bregma − ; the brain with green, blue, and purple squares) at the base of the brain, as indicated by colored squares. Values from all graphs are means ± SEM (n = 6 animals per group). ****/####P < 0.0001, ***/###P < 0.001, **/##P < 0.01, and */#P < 0.05 versus sham + vehicle and SAH + vehicle, respectively. Statistical significance was determined by one-way ANOVA Bonferroni corrected. d Representative images indicating microglia/macrophage morphology in response to SAH operation and minocycline administration. Bar indicates 20 µm. Although cell bodies of Iba1-positive cells in sham mice appeared thin and elongated, they were found with the typical amoeboid cell morphology, indicating the activated state in SAH mice. Minocycline administration did not markedly change the cell morphology when compared to sham + vehicle. (*) describes significance with respect to sham; (#) describes significance with respect to the SAH + vehicle. ANOVA analysis of variance, DAPI 4',6-diamidino-2-phenylindol, Iba1 ionized calcium-binding adapter molecule 1, SAH subarachnoid hemorrhage, SEM standard error of mean (Color figure online)

