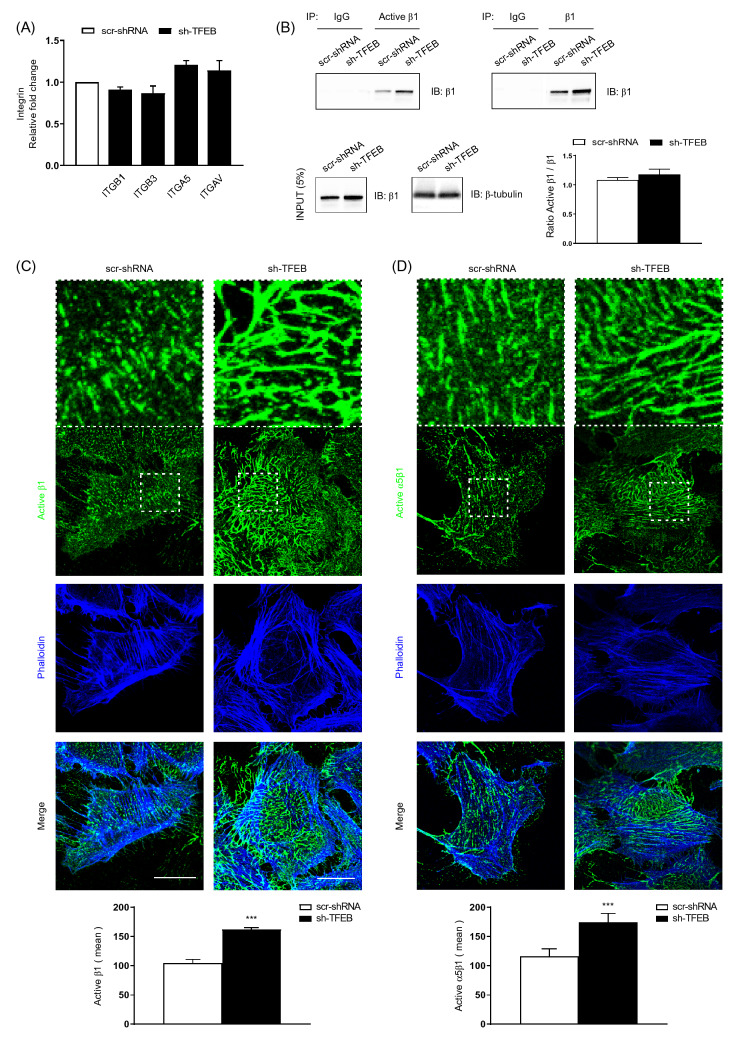
Fig. 2.
TFEB silencing increases the integrin protein levels. A qPCR of ITGB1, ITGB3, ITGA5 and ITGAV expression in scr-shRNA and sh-TFEB-ECs. Data are expressed as relative fold change in sh-TFEB-ECs compared with the expression in scr-shRNA-ECs after normalization to the housekeeping gene TBP (n = 3 independent experiments, values as mean ± SEM; p = ns sh-TFEB-ECs versus scr-shRNA-ECs by Student’s t test). B Representative western blot of active and total β1 integrins immunoprecipitated from scr-shRNA- or sh-TFEB-ECs lysates. After immunoprecipitation (IP) with anti-active β1 integrin (9EG7) and anti-total β1 integrin antibodies, proteins were blotted (IB) with anti-total β1 integrin antibody. In the same lysates used for immunoprecipitation, the endogenous expression of total β1 integrin and β-tubulin were blotted with the specific antibodies and presented as “input”. C, D Confocal microscopy analysis of plasma membrane active-β1 and active- α5β1 integrin expression and localization in living scr-shRNA- and sh-TFEB-ECs following incubation with anti-active β1 integrin (9EG7), active-α5β1 (SNAKA-51) and phalloidin-647 (scale bar: 25 µm). The bar graphs show the quantification of the mean intensity of active-β1 integrin and active- α5β1 (n = 10 cells per condition pooled from three independent experiments; values as mean ± SEM; ***p < 0.0001 sh-TFEB-ECs versus scr-shRNA-ECs, as determined by Student’s t test)

