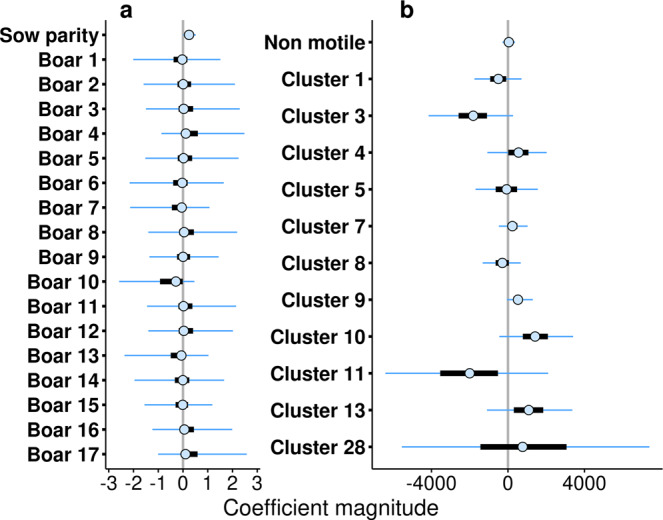
Fig. 2. Estimates of the coefficients and their uncertainty in the fertility model.

The medians of the coefficients are depicted with a clear point, thick black bars represent the 50% credible intervals (C.I.), and the thin lines represent 95% C.I. a Coefficients of animal-related factors (sow parity, individual boars). Sow parity corresponds to the number of times that the sow completed a cycle of insemination. The boars (from 1 to 17) are intercepts that vary amongst individuals (usually known as random effect). b Coefficients corresponding to sperm behaviour related factors (the proportion of non-motile sperm, and the relative proportions of sperm in each of the motility clusters represented in the landscape). Note the different values in the x-axis (coefficient magnitude) for a, b.
