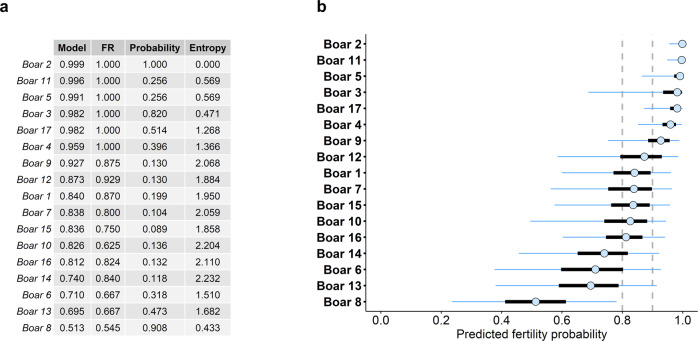
Fig. 4. Predicted fertility per boar.
The values represent the median predicted fertility, expressed as probability of success (successful oocyte fertilisation). a Table of comparison between the estimated (posterior median) fertility, and the farrowing rate (FR), a commonly used measure of fertility. The boars are ranked in descending order according to the predictions of the model. The pseudo-probability (in a 1000 iteration bootstrap) is presented for each boar to be ranked in the current position. Additionally, entropy (calculated as , where p is the probability of belonging to ith position) is used as a measure of position diversity for each of the boars. Namely, a higher entropy corresponds to boars that can be found in a broader range of positions, whereas a lower entropy corresponds to more robust boars. The Kendall’s correlation between the predicted rank and the FR rank was calculated at each bootstrap iteration, yielding a mean correlation of 0.826 ± 0.055 (ranging from 0.662 to 1.000), with a mean p value of 1.7 × 10⁻⁶ ± 6.2 × 10⁻⁶ (ranging from 5.5 × 10⁻¹⁵ to 8.2 × 10⁻⁵). b Predictions with their corresponding uncertainty around the median (open dot). 50% credible intervals (C.I.) are represented by thick, black lines, while 95% C.I. are represented with blue thin lines. Boars are sorted in descending order, according to their estimated fertility (median). The vertical dotted lines represent thresholds at 0.8 and 0.9, corresponding with the categorisation of boars (relatively low or high fertility, respectively).

