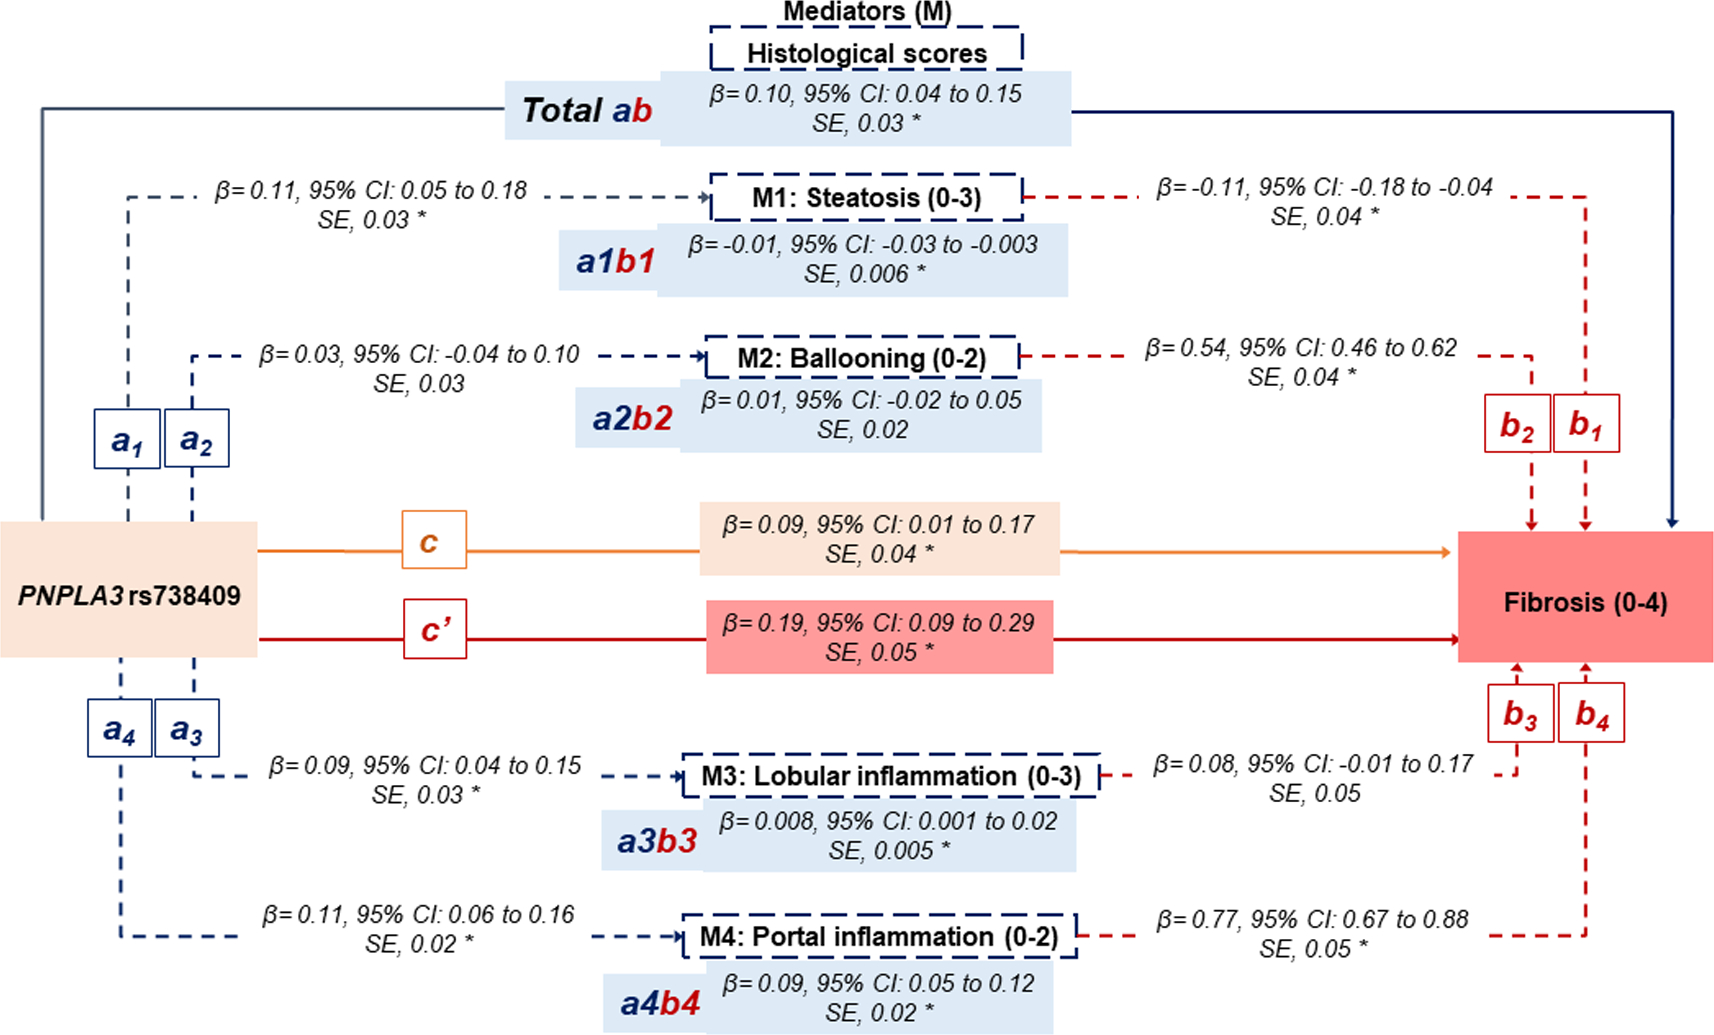
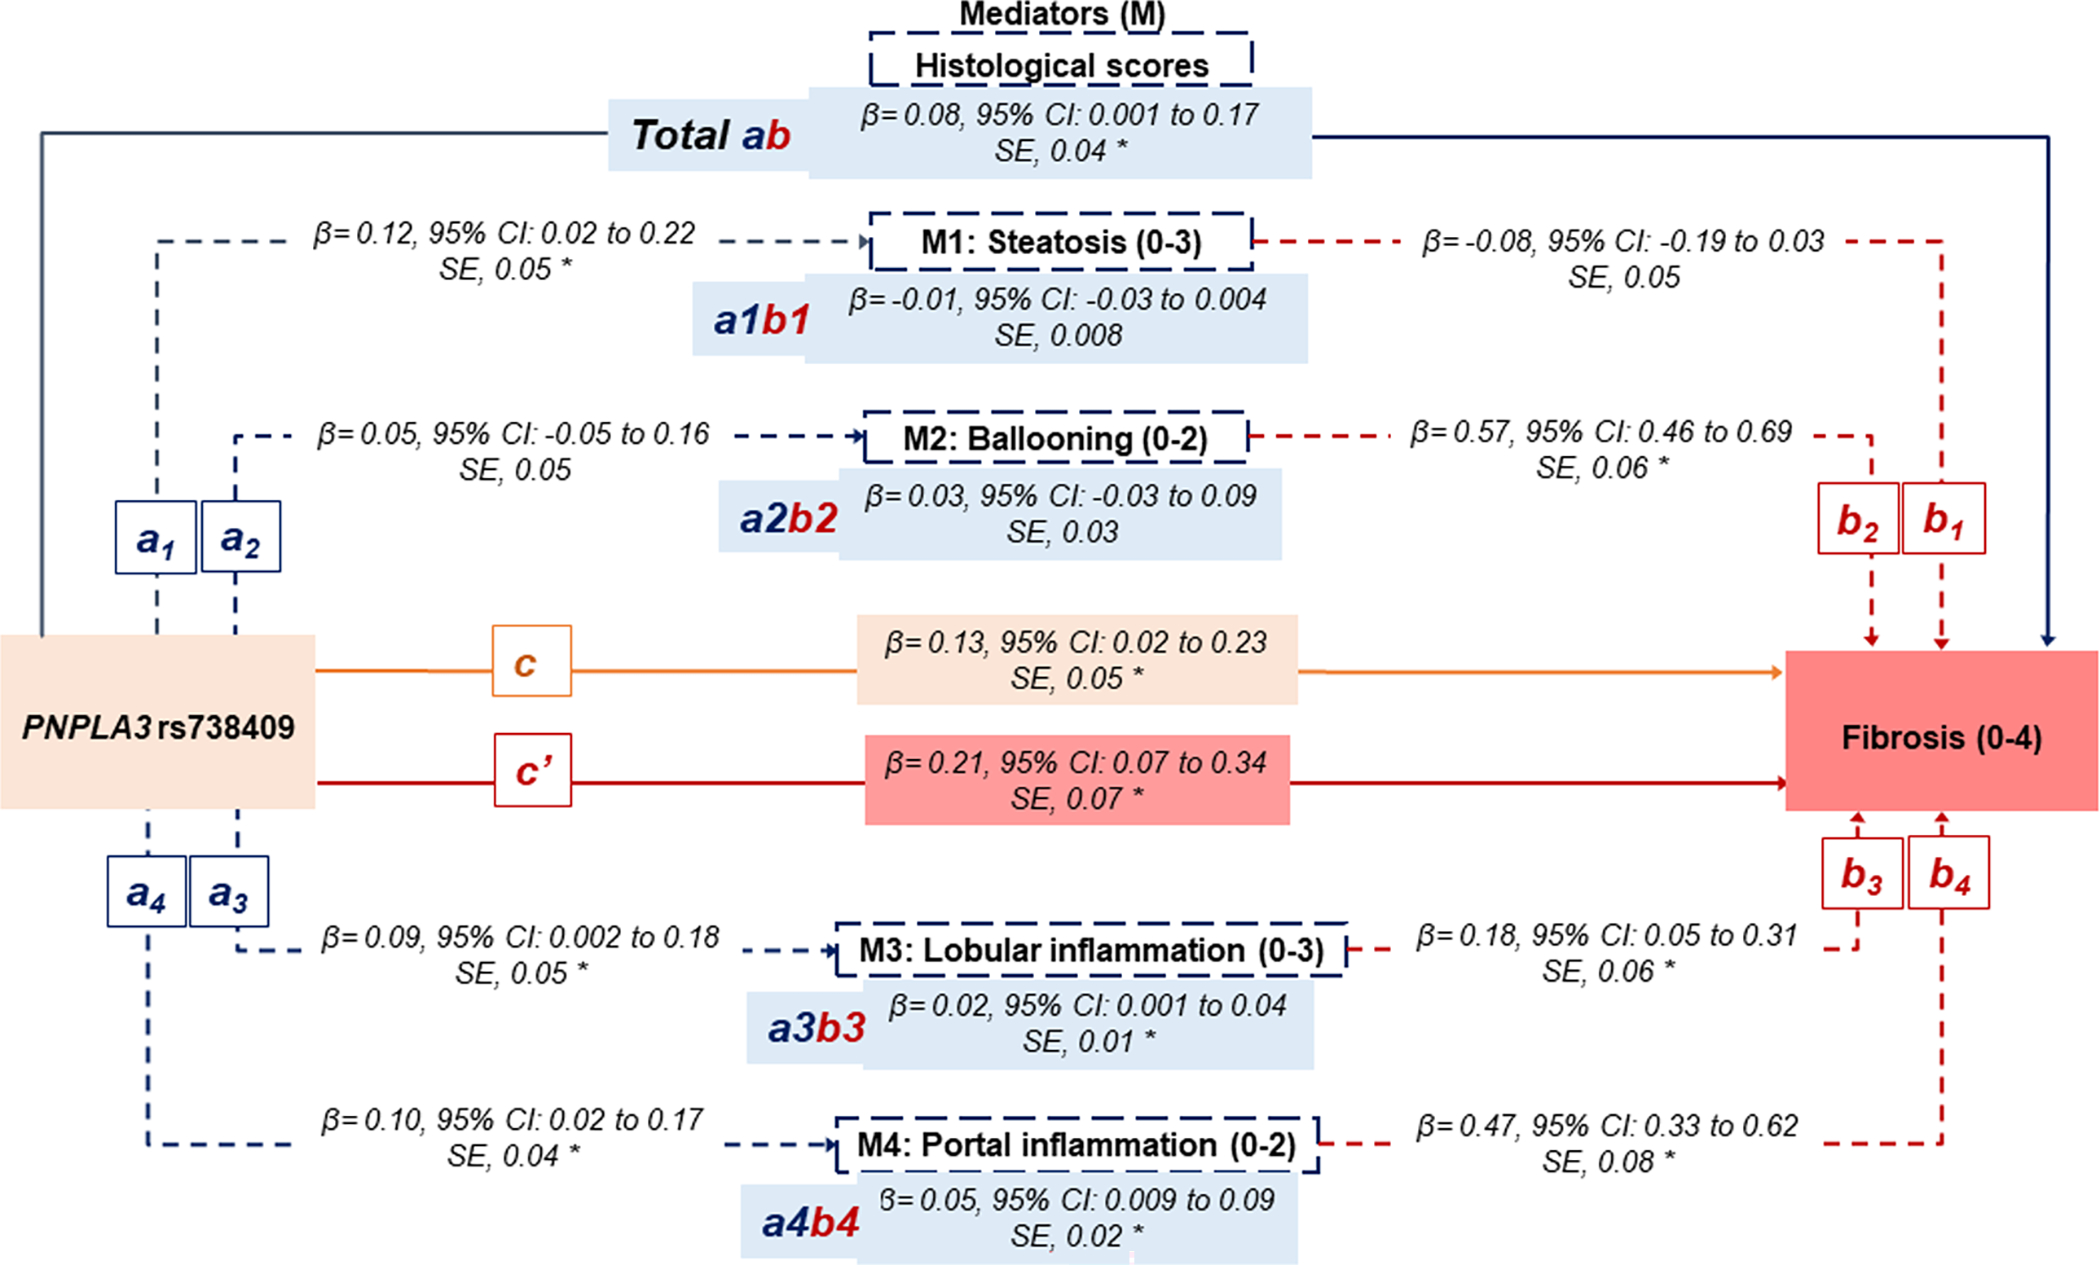
Figure 1.


Statistical diagram of a parallel mediation model including 4 mediators.
A) The non-Hispanic White population (n=1153). </p/>. B) Hispanic, non-Hispanic Black, non-Hispanic Asian, and other/multiracial (n=404).
a: The effect of rs738409 on the mediator (individual histological score)
b: The effect of the mediator (individual histological score) on the fibrosis score.
ab: The indirect effect of the rs738409 on the fibrosis score through each mediator (individual histological score).
Total ab: The sum of all indirect effects of the rs738409 on the fibrosis score through all mediators.
c: The direct effect of rs738409 on the fibrosis score, not operating through mediators.
c’: the total effect of rs738409.
β indicates bootstrap coefficients.
All analyses adjusted for age, gender, BMI (kg/m2), T2DM, non-heavy alcohol intake, PNPLA3 rs738409, HSD17B13 rs72613567, TM6SF2 rs58542926, MBOAT7 rs641738. Race/ethnicity was further included in the multivariable analysis focusing on the other racial/ethnic groups.
The star symbol (*) represents statistically significant paths.
