
Figure 3.
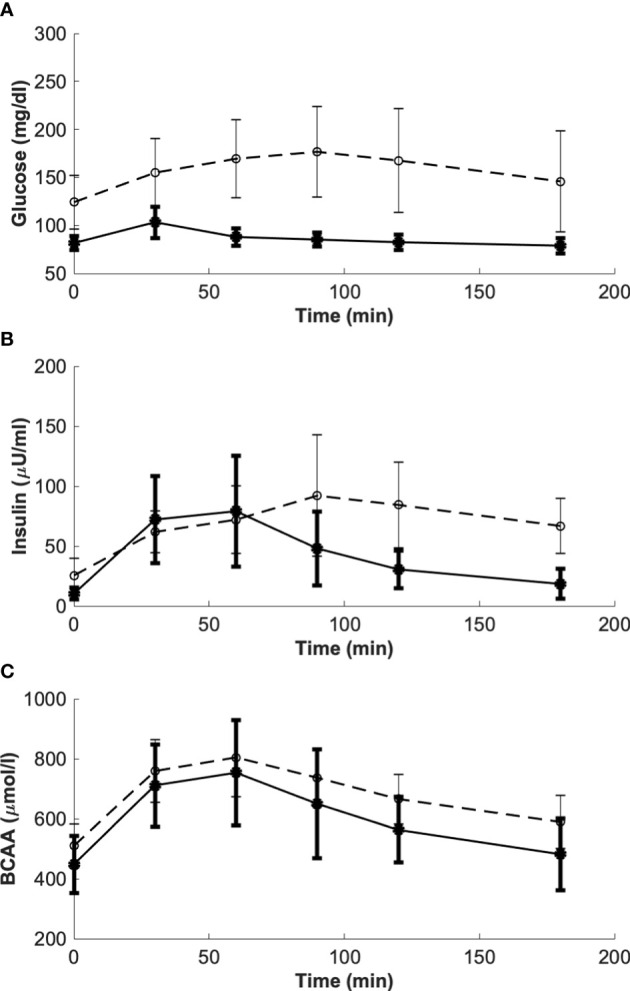
Glucose, insulin and BCAA curves from the reference mean experimental data by Karusheva et al. (7) (panels A–C, respectively), for glucose-tolerant participants (CNT, n=10, solid line) and patients affected by type 2 diabetes (T2D, n=10, dashed line). Closed and open circles (for CNT and T2D, respectively) indicate the time instants when the experimental samples were collected. Data are reported as mean ± SD.