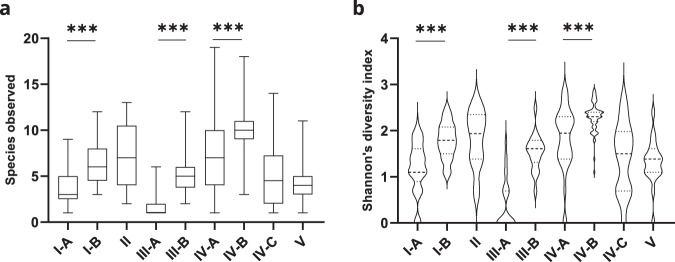
Fig. 2. Microbial richness and diversity associate with novel microbiome profiles.
a Analysis of species richness shows a significantly higher number of species in samples classified as CSTs I-B, III-B, and IV-B compared to I-A, III-A, and IV-A, respectively. b Analysis of diversity demonstrates a significantly higher diversity in samples classified as CSTs I-B, III-B, and IV-B compared to I-A, III-A, and IV-A, respectively, as evaluated by Shannon’s index. Error bars represent means ± s.d. and differences in richness and diversity were analyzed by using a Mann–Whitney U test followed by Bonferroni correction. ***p < 0.0001. Source data are provided as a Source data file.

