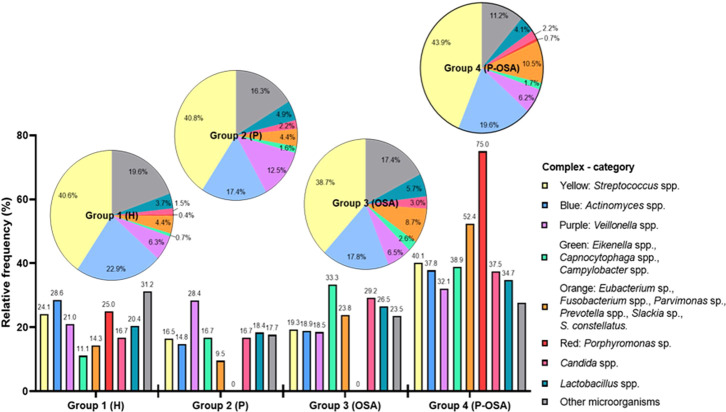
Figure 1.
Microbial community composition is grouped by complexes or categories. Bars indicate the percentages of the inter-group relative frequencies of the complexes/categories in group patients. Pie charts show the intra-group distribution percentages of complexes/categories in group patients: Group 1 (H) healthy patients, non-periodontitis and non-OSA; Group 2 (P) periodontitis and non-OSA patients; Group 3: (OSA) OSA and non-periodontitis patients; Group 4 (P-OSA) periodontitis and OSA patients.

