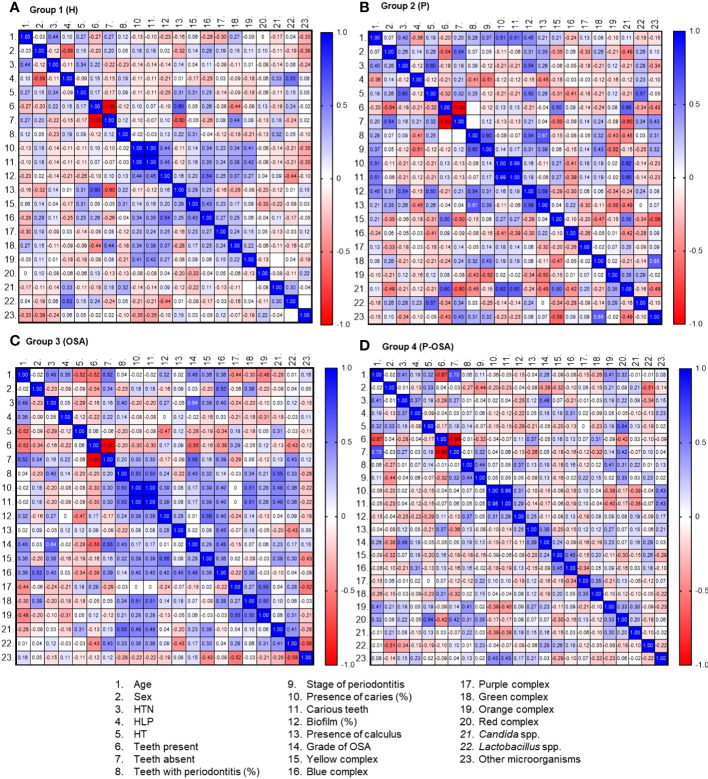
Figure 3.
Multicomponent matrix for the correlation of clinical factors and complex/categories of microorganisms present in each of the groups of patients evaluated: (A) Group 1 (H), n = 25; (B) Group 2 (P), n = 17; (C) Group 3 (OSA), n = 19; (D) Group 4 (P-OSA), n = 32, using the Spearman's rank correlation coefficient rs > 0.30, p<0.05. The blue tones represent a positive correlation and the red tones represent a negative correlation. HTN, arterial hypertension. HLD, hyperlipidemia. HT: hypothyroidism.

