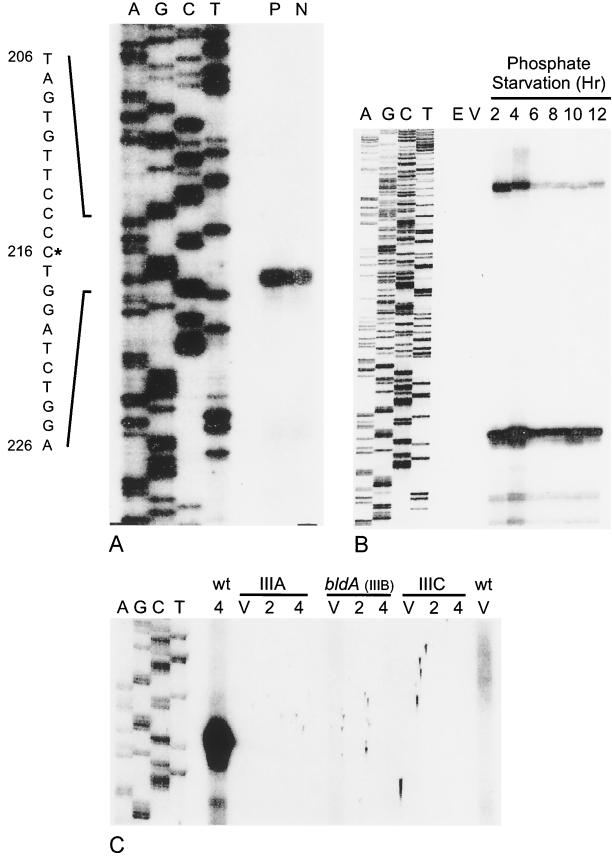
FIG. 4.
Analysis of eshA transcripts by S1 nuclease protection. A single-stranded 400-nt DNA probe (including 20 nt of pGEM-4Z polylinker and 328 nt upstream and 52 nt downstream of the translation start site of the eshA structural gene) was prepared by using oligonucleotide 166 for a primer extension in panel A. Oligonucleotide 167, which extended 116 nt downstream of the initiation codon, was used for the experiments shown in panels B and C. In each case the sequence ladder (A, G, C, T) was extended from the same primer and used as the size marker. (A) Identification of the 5′ end of the eshA transcript in the wild-type strain of S. griseus. P, RNA from cells that had been starved for phosphate for 4 h; N, RNA from cells that had been subjected to nutritional downshift for 4 h. The nucleotide sequence shown to the left of the autoradiogram is that of the sense strand. The asterisk marks the 5′ end of the transcript, and the nucleotide numbers refer to positions in the 2.4-kb SalI fragment (GenBank accession no. L76204). (B) Time course of eshA transcription during phosphate starvation. Total RNA was prepared from vegetative cells (V) and cells that had been starved for phosphate for 2, 4, 6, 8, 10, or 12 h. E. coli tRNA (E) served as the negative control. (C) Analysis of the eshA transcript in the class III mutants during phosphate starvation. The sequence ladder and probe were prepared as described for panel B. Total RNA was prepared from the wild-type strain of S. griseus and class III developmental mutants SKK1015 (class IIIA), SKK1008 (bldA; class IIIB), and SKK1003 (class IIIC) that were growing vegetatively (V) or starved for 2 or 4 h. The film was deliberately overexposed to demonstrate the absence of signal in the mutants.

