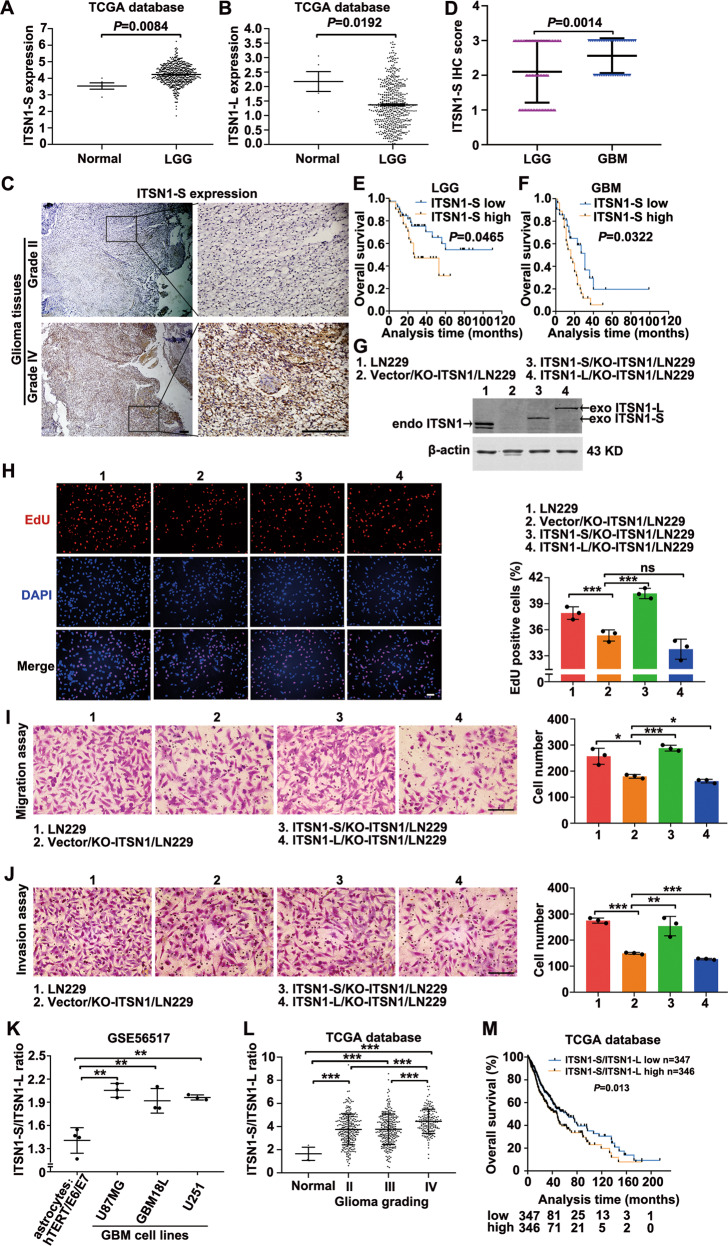
Fig. 1. ITSN1-S and ITSN1-L displayed opposite roles in glioma progression and the ratio of ITSN1-S/ITSN1-L was positively correlated with glioma grading and poor prognosis.
A, B Scatter plot comparing ITSN1-S (A) or ITSN1-L (B) mRNA levels in transcripts per million (TPM) between normal (n = 5) and LGG tissues (n = 528) using the data from TCGA dataset. The y axis represented the transcript expression levels measured by log2(TPM + 1). C Representative images of immunohistochemical staining of ITSN1-S in human glioma tissues with different histological grade. Scale bars, 200 μm. D The immunohistochemistry score of ITSN1-S in LGG (n = 70) and GBM (n = 48) based on our patient samples (P value was calculated by two-tailed Student’s t test). E Kaplan–Meier analyses of the OS of patients with LGG stratified into high- (n = 31) and low-expression (n = 39) groups by ITSN1-S expression. The P value of the log-rank (Mantel-Cox) test was presented. F Kaplan–Meier analyses of the OS of patients with GBM stratified into high- (n = 27) and low-expression (n = 21) groups by ITSN1-S expression. The P value of the log-rank (Mantel-Cox) test was presented. G ITSN1 knockout cells stably infected with lentiviruses of vector, mGFP-ITSN1-S and mGFP-ITSN1-L, respectively, were analyzed by western blot. H EdU assay was used to detect proliferation ability of the indicated cells. Scale bars, 100 μm. I Migration assay results. Cells migrating through transwell inserts were stained, photographed, and quantified. Scale bars, 200 μm. J Invasion assay results. Cells invading through matrigel matrix-coated transwell inserts were stained, photographed, and quantified, scale bars, 200 μm. Values were expressed as mean ± SD from three independent experiments in (H–J) (two-tailed Student’s t test, *P < 0.05, **P < 0.01, ***P < 0.001, ns, no significance). K Scatter plot comparing the mRNA expression ratio of ITSN1-S/ITSN1-L in immortalized human astrocytes and GBM cell lines (two-tailed Student’s t test, **P < 0.01). L The mRNA expression ratio of ITSN1-S/ITSN1-L in normal and different grades of glioma tissues using the data from TCGA datasets (two-tailed Student’s t test, ***P < 0.001). M Kaplan–Meier analyses of the OS of all glioma patients stratified into high- (n = 346) and low-ratio (n = 347) groups by ITSN1-S/ITSN1-L expression ratio.

