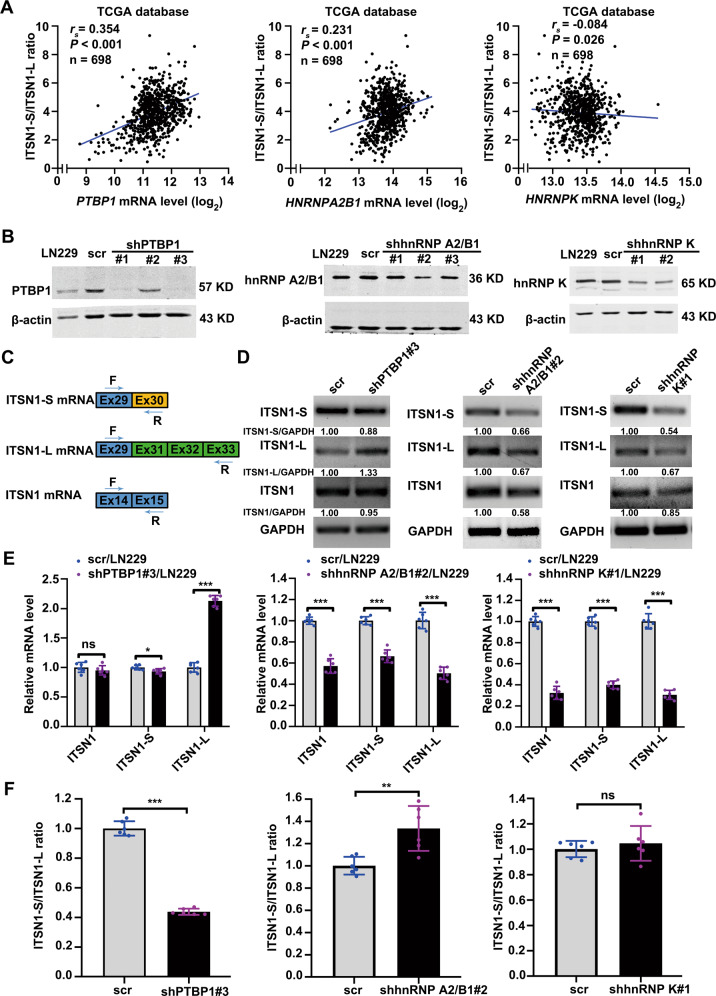
Fig. 3. Knock-down of PTBP1 downregulated the ratio of ITSN1-S/ITSN1-L.
A Scatter plot indicating the correlation of mRNA level of PTBP1, hnRNP A2/B1, and hnRNP K with ITSN1-S/ITSN1-L expression ratio using glioma RNA-Seq data from TCGA database. B Establishment and verification of stable cell lines underexpressing the 3 RBPs above. β-actin was used as an internal control. C Graphical representation of PCR primers for specific detection of ITSN1 and ITSN1-S, ITSN1-L isoforms. D RT–PCR detection of knockdown of the 3 RBPs above in LN229 cells on the expression levels of ITSN1, ITSN1-S, and ITSN1-L. E, F RT–qPCR analysis showing changes in the ITSN1-S, ITSN1-L, and total ITSN1 mRNA level (E) as well as the ratio of ITSN1-S/ITSN1-L (F) upon silencing of the 3 RBPs above in LN229 cells. Values were expressed as mean ± SD from six independent experiments in (E) and (F) (two-tailed Student’s t test, *P < 0.05, **P < 0.01, ***P < 0.001, ns, no significance).

