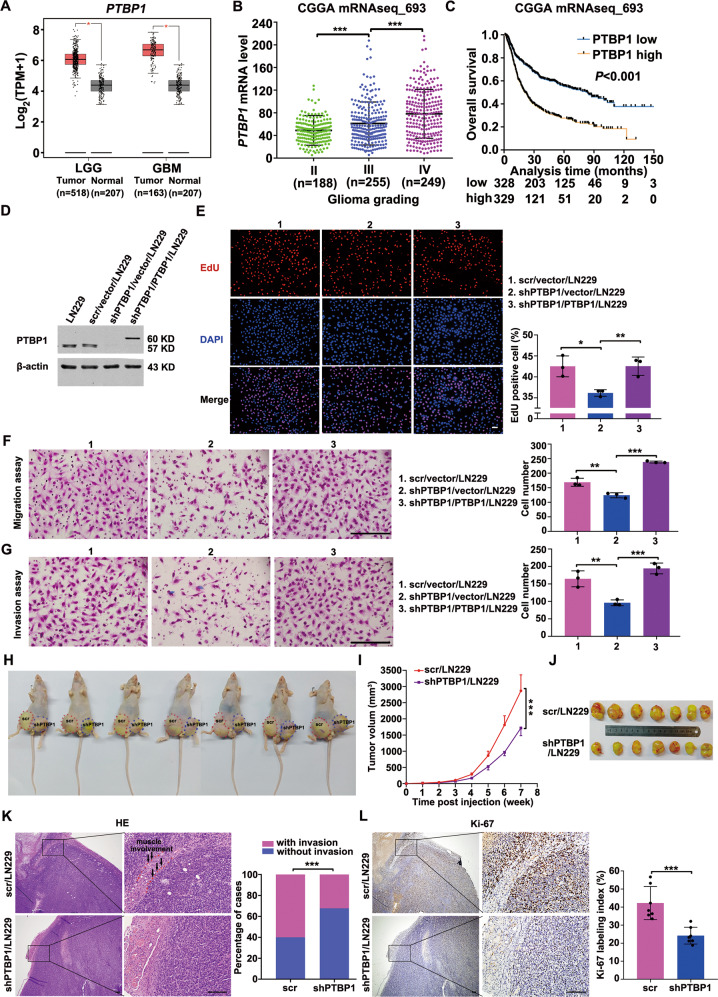
Fig. 5. PTBP1 promoted glioma progression.
A PTBP1 expression was evaluated between LGG or GBM and normal samples by GEPIA. B Scatter plot comparing PTBP1 mRNA levels between different grades of glioma using the data from CGGA. C Curves of Kaplan–Meier analysis. OS was analyzed according to the PTBP1 expression (cut-off at 50% of the entire group). Low PTBP1 expression was related to long OS (P < 0.001). D Western blot analysis of PTBP1 knockdown and rescue in the extracts of cells as indicated. Loading control: β-actin. E Images of EdU staining (left, scale bars, 100 μm) and the comparison of EdU-positive rates between the control and silencing PTBP1 cells (right). F Migration assay of the indicated cells. Cells migrating through transwell inserts were stained, photographed, and quantified. Scale bars, 200 μm. G Invasion assay results. Cells invading through matrigel matrix-coated transwell inserts were stained, photographed, and quantified. Scale bars, 200 μm. Values were expressed as mean ± SD from three independent experiments in (E–G) (two-tailed Student’s t test, *P < 0.05, **P < 0.01, ***P < 0.001). H Nude mice injected with control or silencing PTBP1 LN229 cells. The images shown represent results for 7 mice. Red and blue dotted lines indicated the location and size of the tumors. I Growth curve of nude mice tumors within 7 weeks, values were expressed as mean ± SD (two-way ANOVA, ***P < 0.001). J The representative images show the xenograft tumors isolated from nude mice at the 7th week of tumor inoculation. K Representative images of hematoxylin-eosin staining (left), scale bars, 200 μm. The frequency of xenograft invasion in mice was analyzed quantitatively (right), P value was calculated using the chi-square test. ***P < 0.001. L Immunohistochemical images of tumor sections stained for Ki67 from control or PTBP1 knock down mice (left), quantitation of the percentage of Ki67-positive cells in tumor sections (right). Values are mean ± SD, two-tailed Student’s t test, ***P < 0.001. Scale bars, 200 μm.

