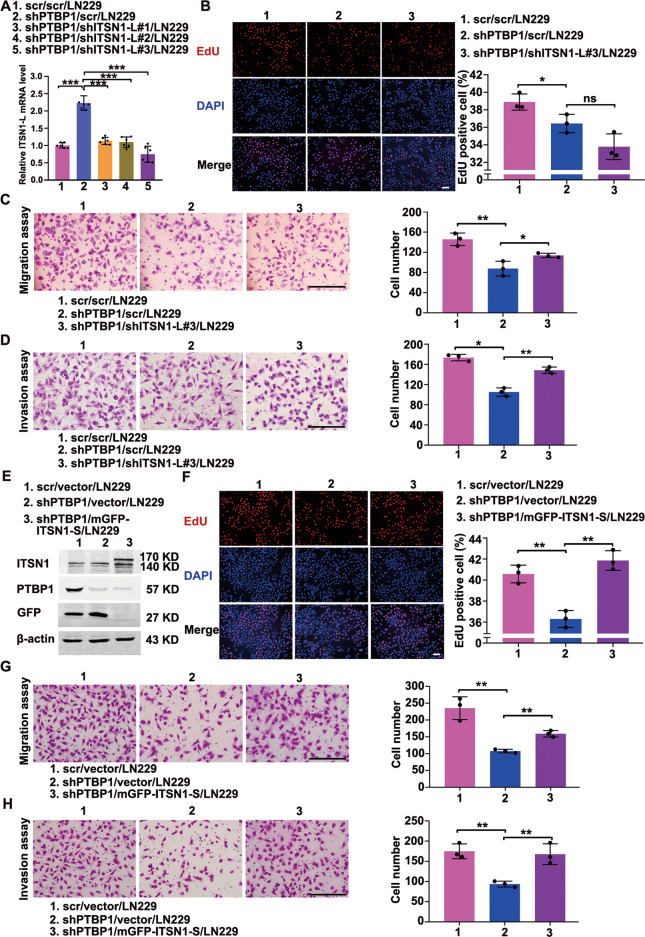
Fig. 6. PTBP1 promoted proliferation, migration, and invasion of glioma cells by regulating alternative splicing of ITSN1 in vitro.
A Establishment and verification of stable cell lines silencing PTBP1 followed by knocking down of ITNS1-L, Values were expressed as mean ± SD from six independent experiments (two-tailed Student’s t test, ***P < 0.001). B Images of EdU staining (left, scale bars, 100 μm) and the comparison of EdU-positive rates among indicated cells (right). C Migration assay of the indicated cells. Cells migrating through transwell inserts were stained, photographed, and quantified. Scale bars, 200 μm. D Invasion assay results. Cells invading through matrigel matrix-coated transwell inserts were stained, photographed, and quantified. Scale bars, 200 μm. E Western blot analysis of stable cell lines silencing PTBP1 followed by overexpression of ITSN1-S. F Images of EdU staining (left, scale bars, 100 μm) and the comparison of EdU-positive rates among indicated cells (right). G Migration assay of the indicated cells. Cells migrating through transwell inserts were stained, photographed, and quantified. Scale bars, 200 μm. H Invasion assay of the indicated cells. Cells invading through matrigel matrix-coated transwell inserts were stained, photographed, and quantified. Scale bars, 200 μm. Values were expressed as mean ± SD from three independent experiments in (B–D) and (F–H) (two-tailed Student’s t test, *P < 0.05, **P < 0.01, ns, no significance).

