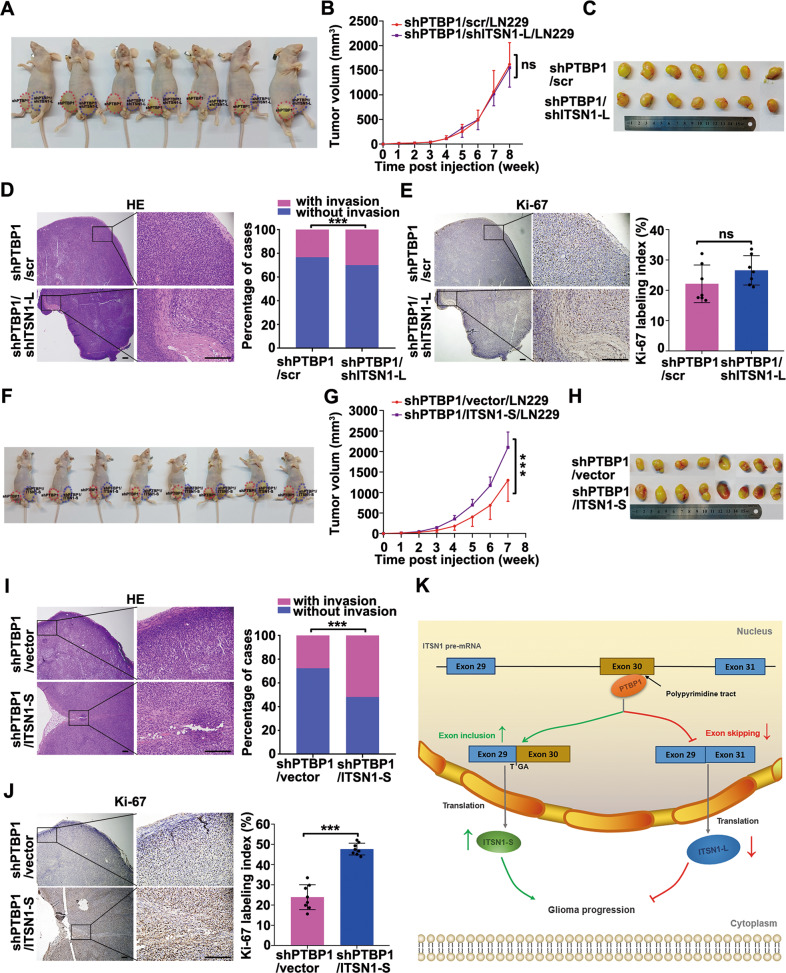
Fig. 7. PTBP1 promoted proliferation, migration, and invasion of glioma cells by regulating alternative splicing of ITSN1 in vivo.
A Nude mice injected with silencing PTBP1 or silencing PTBP1 combined with inhibition of ITSN1-L LN229 cells. The images shown represent results for 7 mice. Red and blue dotted lines indicated the location and size of the tumors. B Tumor growth curve in indicated nude mice. values were expressed as mean ± SD (two-way ANOVA, ns, no significance). C The representative images show xenograft tumor tissues isolated from the nude mice. D Representative images of hematoxylin-eosin staining (left, scale bars, 200 μm), the frequency of xenograft invasion in mice was analyzed quantitatively (right), P value was calculated using the chi-square test. ***P < 0.001. E Representative immunohistochemical staining with anti-Ki67 in xenograft tumor sections (left, scale bars, 200 μm), the percentage of positive staining cells with the expression of Ki67 in xenografts were quantified (right). F Nude mice injected with silencing PTBP1 or silencing PTBP1 combined with overexpression of ITSN1-S LN229 cells. The images shown represent results for 8 mice. Red and blue dotted lines indicated the location and size of the tumors. G Tumor growth curve in indicated nude mice, values were expressed as mean ± SD (two-way ANOVA, ***P < 0.001). H The representative images show the xenograft tumors isolated from nude mice after sacrificed. I Representative images of hematoxylin-eosin staining in indicated tumor sections (left, scale bars, 200 μm), the frequency of xenograft invasion in mice was analyzed by quantitatively (right), P value was calculated using the chi-square test. ***P < 0.001. J Immunohistochemistry for Ki67 of representative images in tumor sections (left, scale bars, 200 μm), the expression of Ki67 was quantified with percentage of Ki67-positive cells to the total cells in tumor sections (right) (two-tailed Student’s t test, ***P < 0.001). K A proposed schema involving PTBP1 enhanced the inclusion of ITSN1 exon 30 to promote glioma progression. PTBP1 enhanced ITSN1 exon 30 inclusion through the binding of poly-pyrimidine sequences of exon 30, and the expression of ITSN1-S increased as well as the expression of ITSN1-L decreased, which promoted glioma progression.

