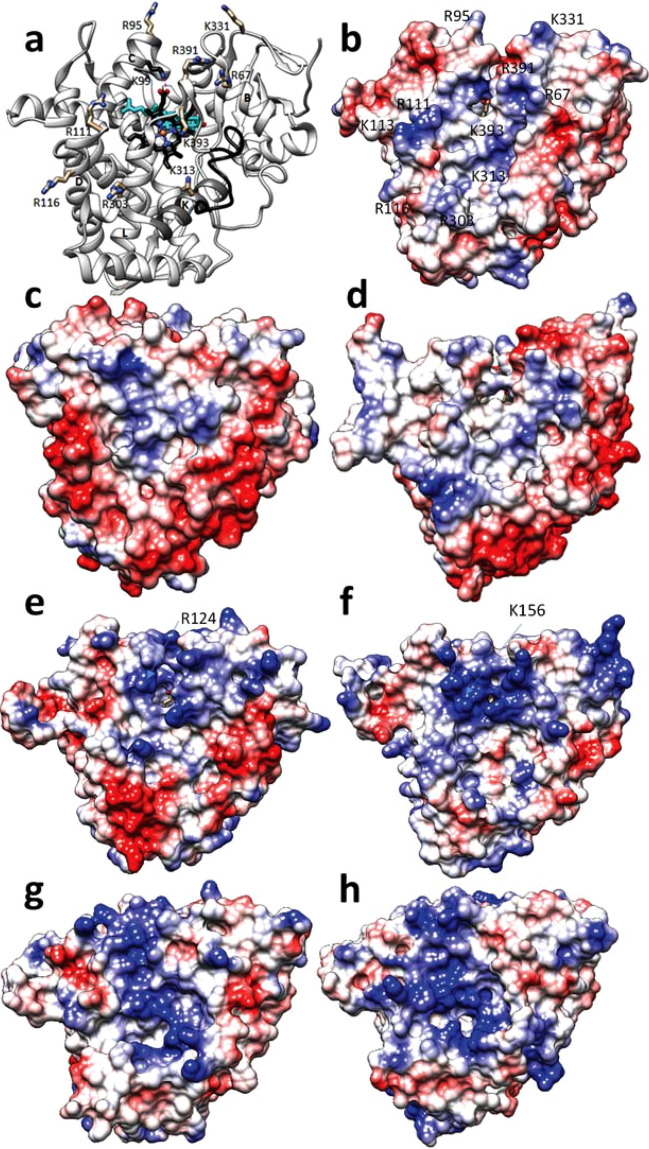
Figure 7.
Proximal P450 surface. (a) Positively charged residues in the lanosterol-bound M. capsulatus CYP51 molecule. The ribbon of helix K (306–318) is colored in dim grey, the meander (370–385) is in black. The heme and lanosterol are shown as black and cyan stick models, respectively. K99 (colored in black) is not exposed to the surface, its side chain retains the H-bond with the heme ring D propionate. (b–f) Electrostatic potential mapped onto the surface of bacterial (b–d) versus eukaryotic microsomal (e,f) and mitochondrial P450s (g,h). (b) M. capsulatus CYP51 [7SNM], (c) Tepidiphilus thermophiles CYP116B46 (P450TT, 6LAA), (d) M. tuberculosis CYP51 [1E9X], (e) T. cruzi CYP51 [6FMO], (f) human CYP51 [6UEZ], (g) human CYP11A1 [P450scc, 3N9Y], (h) CYP11B2 [7M8I]. Red for positive and blue for negative charge, white for neutral. The view of the superimposed structures is the same as in (a).

