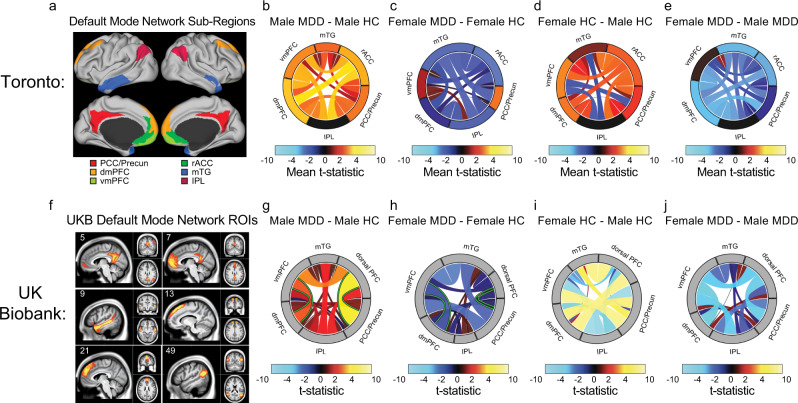
Fig. 2. Sex-dependent effects of depression on DMN connectivity in two independent samples.
a Default mode network (DMN) ROIs in the Glasser parcellation used in our primary analyses. b–e Circle plots (facilitating comparisons with the UK Biobank parcellation in [f–j]) depicting rsFC effects for six DMN subregions comparing four groups of subjects: healthy men (n = 79), men with MDD (n = 148), healthy women (n = 103), and women with MDD (n = 223). Colors and band thickness scale with the mean of all significant (unadjusted p < 0.05) t-statistics. Warm colors denote increased connectivity in MDD patients compared to controls (b, c) or in women compared to men (d, e). dmPFC dorsomedial prefrontal cortex, vmPFC ventromedial prefrontal cortex, rACC rostral anterior cingulate, PCC/Precuneus posterior cingulate and precuneus, mTG medial temporal gyrus, IPL inferior parietal lobule. f Six UK BioBank ICA components comprising the DMN are depicted in sagittal, coronal, and axial brain images. The component numbers in the upper left of each image specify the ICA component as defined in the UK Biobank ICA parcellation, available at https://www.fmrib.ox.ac.uk/ukbiobank/. Component 5 = posterior cingulate/precuneus (PCC/Precun); 7 = ventromedial prefrontal cortex (vmPFC); 9 = medial temporal gyrus (mTG); 13 = dorsomedial PFC (dmPFC); 21 = dorsal PFC; and 49 = inferior parietal lobule (IPL). g–j Circle plots (facilitating comparisons with the Glasser parcellation in [a–e]) depicting rsFC effects for six DMN sub-regions comparing four groups of subjects as in (b–e): healthy men (n = 1907), men with probable MDD who also reported severe MDD symptoms at the time of their scan (n = 28), healthy women (n = 1773), and women with probable MDD who also reported severe MDD symptoms at the time of their scan (n = 81). Warm colors denote increased connectivity in symptomatic UKB subjects with probable MDD compared to controls (g, h) or in women compared to men (I, j). Effects showing a significant MDD-by-sex interaction effect (FDRq < 0.05) are highlighted in green. Note that we used circle plots to represent the results in order to facilitate comparisons between the two parcellations. In the Glasser parcellation, each region included multiple functional parcels, so each band represents the mean of all significantly different connections between a given pair of regions. In the UKB parcellation, each region is represented by just one ICA-based functional parcel, so each band represents a single t-statistic between a given pair of regions.

