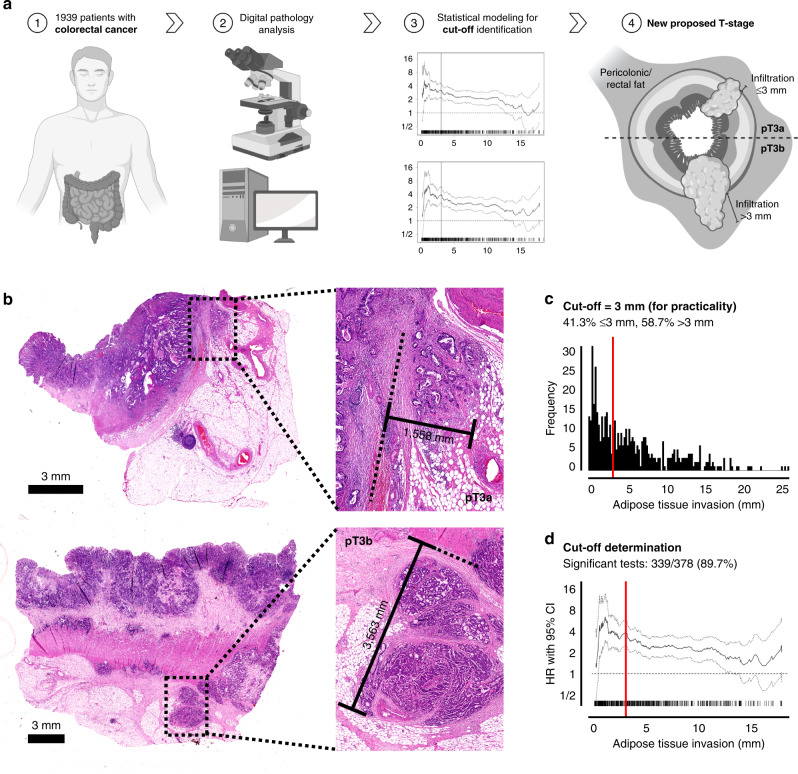
Fig. 1. Overall workflow of the study/histological measurements/cut-off determination.
a Graphical abstract/overview of the workflow (graphics generated using www.BioRender.com). b Example of the histological measurement of the histological depth of invasion depicting a pT3a case (upper panel) and a pT3b case (lower panel). The measurement was performed from the edge of the muscular layer to the deepest identifiable cancer cell within the adipose tissue. c, d Determination of the Cutoffs used for the pT3a/b subclassification guided by the biostatistical tool Cutoff finder [11]. The upper panel shows the frequency of the depth of adipose tissue invasion, the optimal cut-off is shown by the red line. The lower panel shows the hazard ratio for DSS in dependence of the cut-off point.

