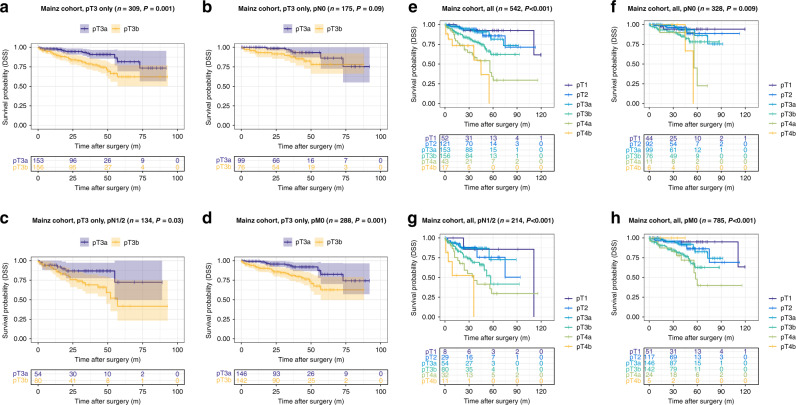
Fig. 3. Survival analyses (log-rank test) of the proposed pT3a subclassification in validation cohort 1 (Mainz).
a–d Disease-specific survival analysis of pT3a vs. pT3b CRCs within all pT3 tumours (a) and in pN0 (b), pN1/2 (c) and pM0 subgroups (d) of patients with pT3 tumours. e–h Disease-specific survival analysis of pT3a vs. pT3b CRCs compared to all pT stages in the overall cohort (e) and in pN0 (f), pN1/2 (g) and pM0 subgroups (h).

