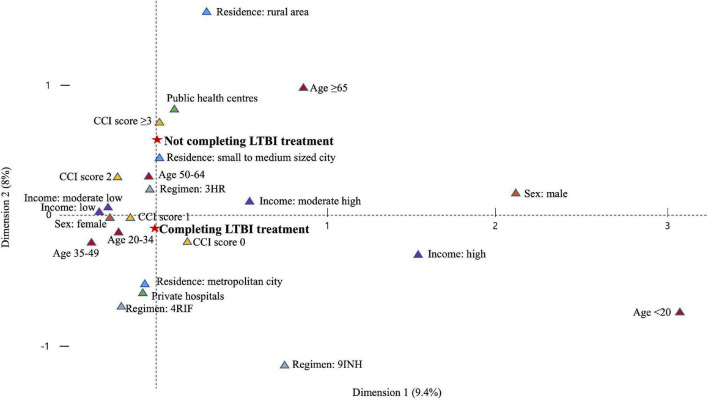
FIGURE 6.
Plot of multiple correspondence analysis representing the relation between not completing treatment and explanatory variables. LTBI, latent tuberculosis infection; CCI, Charlson comorbidity index; 3HR, 3-month of rifampin and isoniazid combination therapy; 9INH, 9-month of isoniazid monotherapy; 4RIF, 4-month of rifampin monotherapy.

