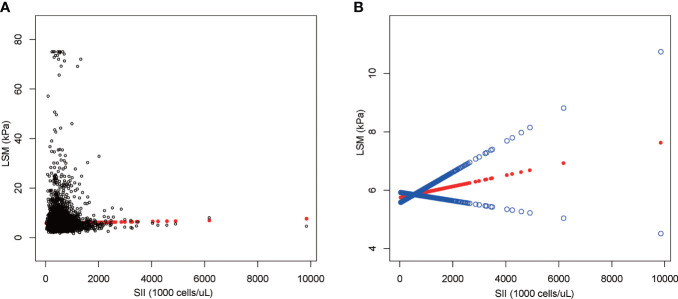
Figure 4.
The association between SII and LSM. (A) Each black point represents a sample. (B) The solid red line represents the smooth curve fit between variables. Blue bands represent the 95% confidence interval from the fit. SII, systemic immune-inflammation index; LSM, liver stiffness measurement.

