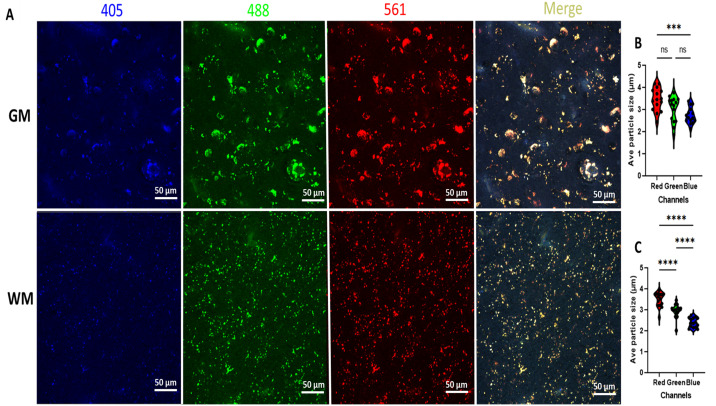
Figure 2.
Photomicrographs from human brain (white and gray matter) before light exposure (nPhotoQ).
(A) Photomicrographs showing LAF fluorescence levels at 405, 488, and 561 nm wavelength in human white and gray matter before photo-quenching (nPhotoQ). (B) Violin plots showing the comparison of the average LAF particle size at 405, 488, and 561 nm wavelength in grey matter (GM) (***p = 0.0006, ns p > 0.05) (C) violin plots showing the comparison of average LAF particle size at 405, 488, and 561 nm wavelength in white matter (WM) (****p < 0.0001).

