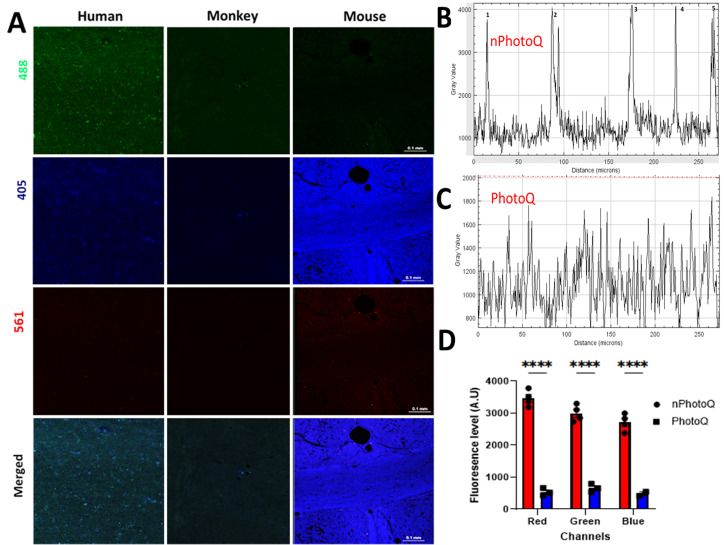
Figure 4.
Photomicrographs from human, monkey, and mouse cerebral white matter after 72 h light exposure.
(A) Photomicrographs showing fluorescence levels at 405, 488, and 561 nm wavelength in human, monkey, and mouse WM. (B) Gray value graph showing the LAF fluoresce intensity level and background in a human WM sample before photoQ exposure with high peaks (1, 2, 3,4, and 5). (C) Gray value graph showing the reduced fluorescence intensity levels and background after 72 h photoQ exposure from the same human WM sample as in B. (D) Bar graph showing the comparison of fluorescence levels before and after the light exposure (****p < 0.0001) in a human sample using the approach illustrated in supplemental figure 1.

