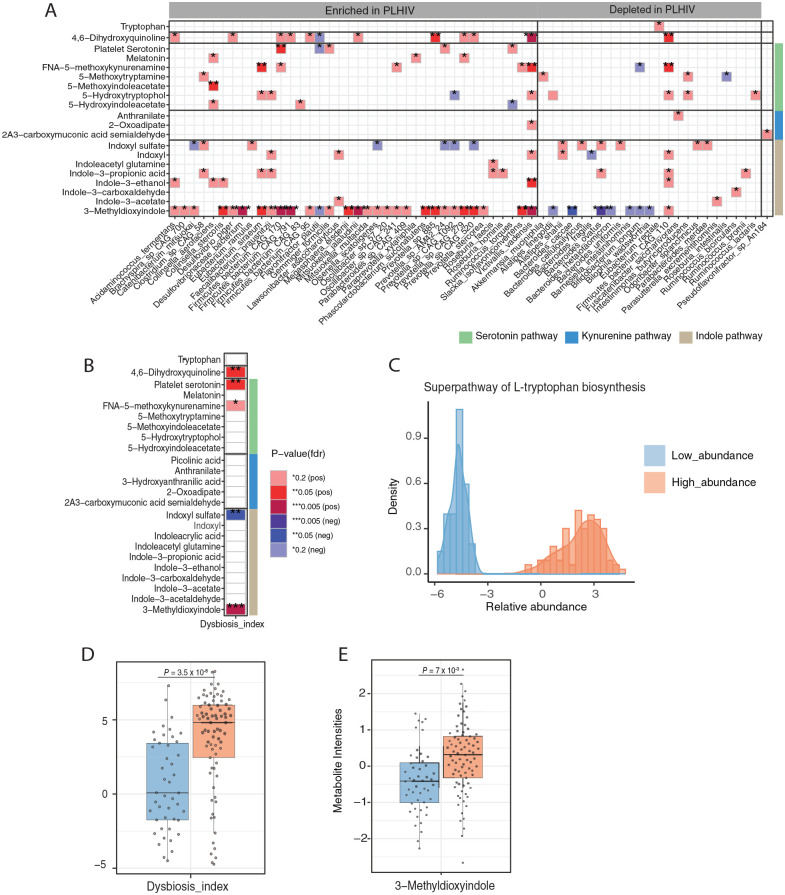
Figure 3.
Association between plasma metabolites of tryptophan metabolism pathway and gut bacterial composition: (A) heatmap presenting significant associations (FDR < 0.2) between metabolites from the tryptophan metabolism pathway and relative abundance of gut bacterial species and (B) dysbiosis index in PLHIV. Green, blue, and brown sidebar represent metabolites from serotonin, kynurenine, and indole pathway respectively, (C) histogram of relative abundance of bacteria belonging to the “Superpathway L-Tryptophan biosynthesis” as measured in PLHIV, (D) box plots depicting the dysbiosis index, and (E) relative abundance of 3-methyldioxyindole in PLHIV stratified by high (n = 81) and low abundance group (n = 48). In each box plot, the in-box line defines the median value, hinges depict 25th and 75th percentiles and whiskers extend to ±1.5 interquartile ranges; each dot indicates an individual. All values were inversed ranked transformed. The analysis was performed using a linear regression model using age, sex, and read counts.
Abbreviation: 2A3-carboxymuconic acid acetaldehyde, 2-Amino-3-carboxymuconic acid acetaldehyde; FNA-5-methoxykynurenamine, formyl-N-acetyl-5-methoxykynurenamine.

