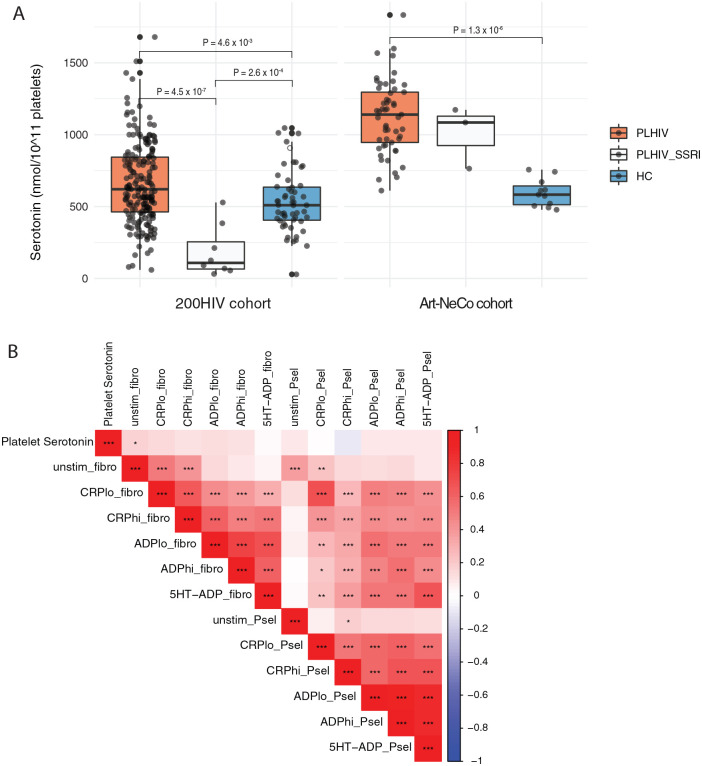
Figure 4.
Comparison of platelet serotonin concentration between PLHIV and healthy controls: (A) comparison of platelet serotonin concentration between PLHIV non-SSRI users, PLHIV-SSRI users, and healthy controls in 200HIV cohort (left) and Art-NeCo cohort (right). The analysis was performed by linear regression model using age and sex as covariates. In each box plot, the in-box line defines the median value, hinges depict 25th and 75th percentiles and whiskers extend to ±1.5 interquartile ranges; each dot indicates an individual participant and (B) association between platelet serotonin concentration and platelet reactivity parameters in PLHIV of 200HIV cohort. Red and blue cells indicate a positive and negative correlation, respectively. Asterisk (*) indicates statistical significance after FDR multiple testing correction at P < .05 (*), P < .001 (**), and P < .0001 (***) using spearman’s rank correlation.
Abbreviations: Unstimulated P-selectin expression (unstim_Psel) and fibrinogen binding (unstim_fibro); low and high dose of ADP-stimulated P-selectin expression (ADPlo_Psel and ADPhi_Psel) and fibrinogen binding (ADPlo_fibro and ADPhi_fibro); low and high dose of CRP-XL-stimulated P-selectin expression (CRPlo_Psel and CRPhi_Psel) and fibrinogen binding (CRPlo_Fibro and CRPhi_Fibro); low dose of ADP and serotonin-stimulated P-selectin expression (5HT-ADP_Psel) and fibrinogen binding (5HT-ADP_fibro).

