Figure 5.
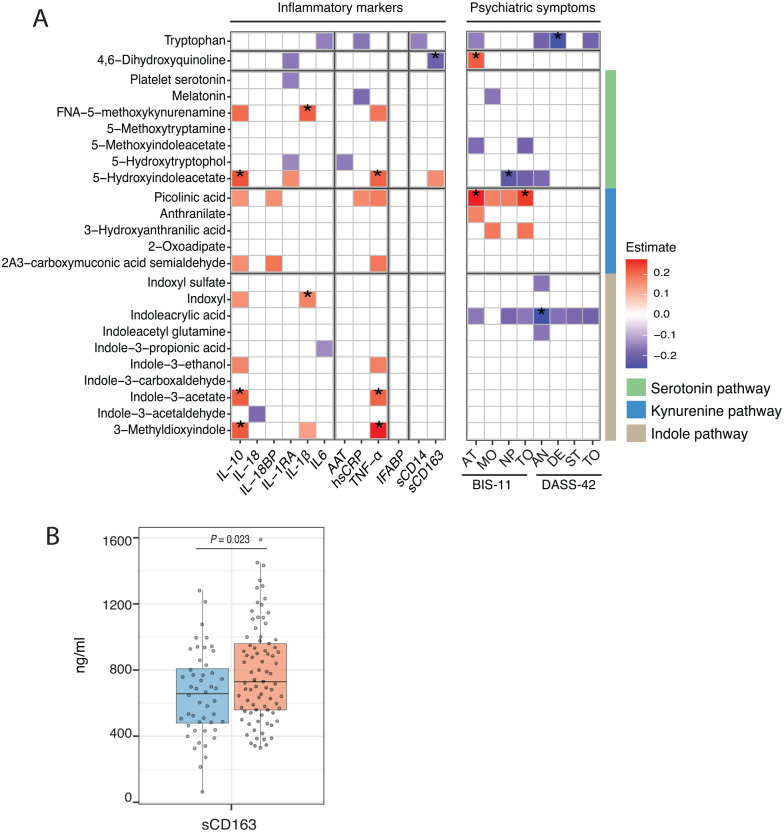
Association between plasma metabolites of tryptophan metabolism and inflammatory markers and psychiatric symptoms: (A) tryptophan metabolism association to inflammatory markers and psychiatric symptoms. (Left) Heatmap presenting the estimate of significant association (P < .05) between tryptophan metabolism pathway and plasma inflammatory markers in PLHIV. (Right) Heatmap presenting the estimate of significant associations (P < .05) between tryptophan metabolism pathway and DASS-42 and BIS-11 subscores in PLHIV. The analysis was performed using a linear regression model using age and sex as covariates. Asterisk (*) indicates statistical significance at FDR < 0.2. Green, blue, and brown sidebar represent metabolites from serotonin, kynurenine, and indole pathway respectively and (B) box plots depicting the difference in sCD163 concentration between the high (n = 81) and low abundance group (n = 48) of “Superpathway L-Tryptophan biosynthesis” microbial pathway in PLHIV. The in-box line defines the median value, hinges depict 25th and 75th percentiles and whiskers extend to ±1.5 interquartile ranges; each dot indicates an individual participant.
Abbreviations: 2A3-carboxymuconic acid acetaldehyde, 2-Amino-3-carboxymuconic acid acetaldehyde; AN, anxiety; AT, attentional impulsivity; DE, depression; FNA-5-methoxykynurenamine, formyl-N-acetyl-5-methoxykynurenamine; MO, motor impulsivity; NP, non planning impulsivity; ST, stress; TO, total DASS-42 or BIS-11 score.

