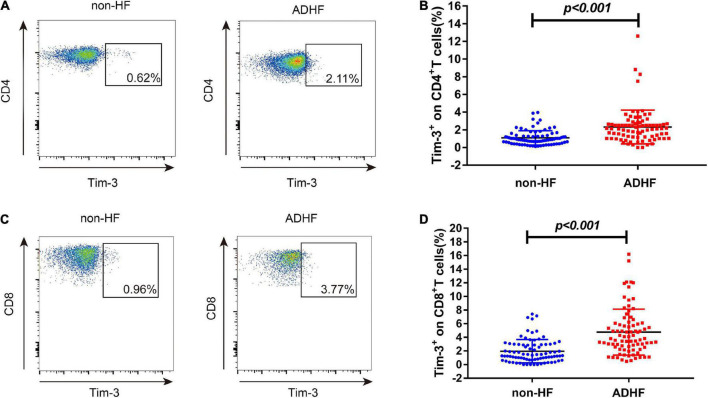
FIGURE 2.
The expression of Tim-3 on CD4+ T cells and CD8+ T cells in non-HF and ADHF groups. Peripheral blood mononuclear cells (PBMCs) were isolated from ADHF group (n = 84) and the non-HF group (n = 83). (A) Flow cytometry analysis of Tim-3 expression on CD4+ T cells. (B) The statistical graph of Tim-3 expression on CD4+ T cells is shown for ADHF group [n = 84, 2.08% (1.15–2.67%)] and non-HF group [n = 83, 0.88% (0.56–1.39%)]. (C) Flow cytometry analysis of Tim-3 expression on CD8+ T cells. (D) The statistical graph of Tim-3 expression on CD8+ T cells is shown for ADHF group [n = 84, 3.81% (2.24–6.03%)] and non-HF group [n = 83, 1.36% (0.76–3.00%)].

