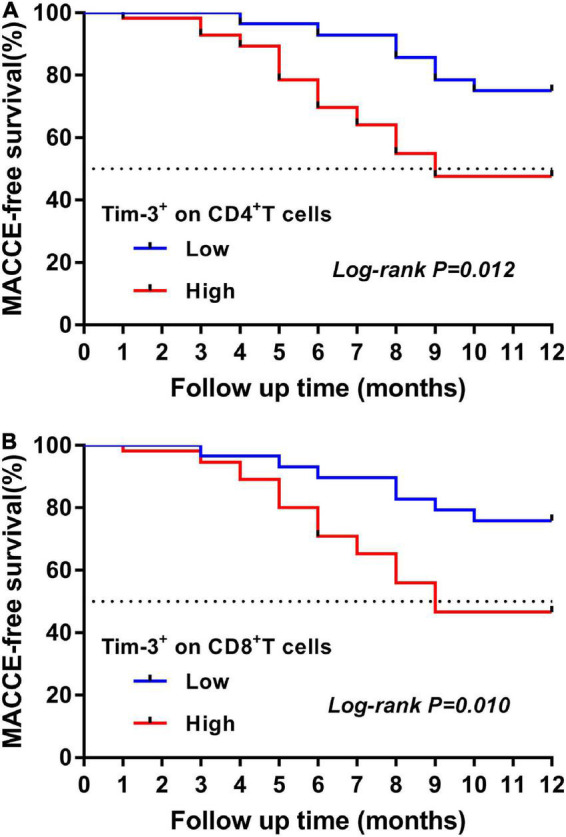
FIGURE 4.

Kaplan-Meier curve for the 12-month MACCE-free survival in patients with ADHF. (A) Time-to-event curves for the highest quartile (Q3–Q4) of Tim-3 expression on CD4+ T cells vs. the lowest quartiles (Q1–Q2) measured in ADHF patients according to the primary endpoints. The log rank test was used to compare the survival curves. (B) Time-to-event curves for the highest quartile (Q3–Q4) of Tim-3 expression on CD8+ T cells vs. the lowest quartiles (Q1–Q2) measured in ADHF patients according to the primary endpoints. The log rank test was used to compare the survival curves.
