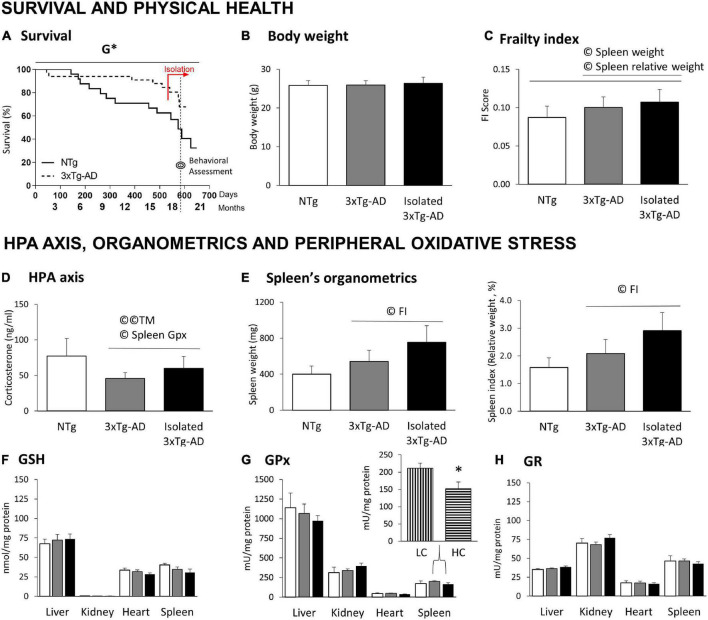
FIGURE 3.
Survival, physical health, HPA axis, and peripheral oxidative stress in 18-month-old 3xTg-AD females compared to NTg females with normal aging. (A) Survival; (B) body weight; (C) frailty index scores; (D) HPA axis measured by Corticosterone levels; (E) organometrics of spleen: weight and spleen index (relative weight, % vs. body weight); Oxidative Stress of liver, kidney, heart, and spleen: (F) GSH levels; (G) GPx enzymatic activity and (H) GR enzymatic activity. Results are expressed as the mean ± SEM. HC (high corticosterone levels), LC (low corticosterone levels). Statistics: Kaplan-Meier and Log-Rank test; G, genotype effect, G *p < 0.05. Student t-test, *p < 0.05 vs. LC counterparts. Pearson’s correlation analysis, ©p < 0.05; ©©p < 0.01; TM, T-maze test; FI, frailty index.

