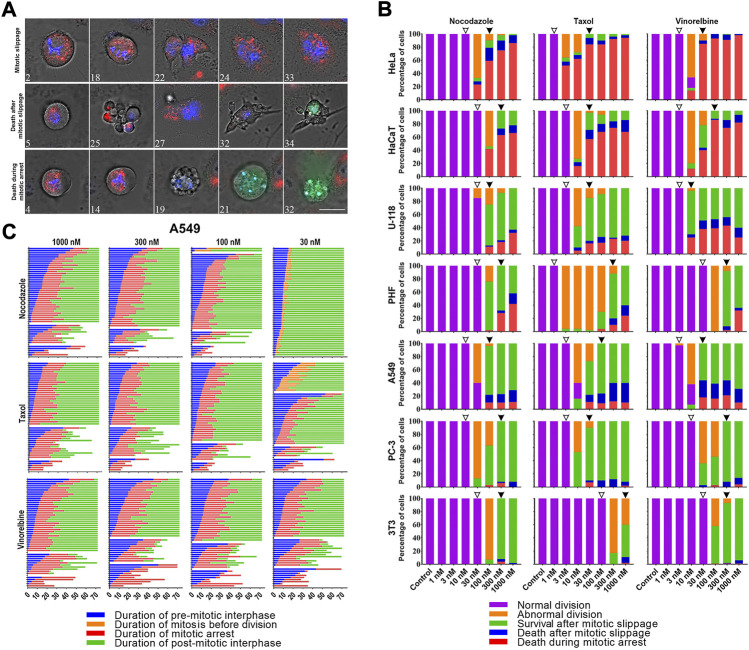
FIGURE 2.
(A) Time-lapse sequences illustrating three fates (mitotic slippage, death after mitotic slippage, and death in mitosis) exhibited by A549 cells under the treatment with 1 uM Taxol. Numbers indicate time from the moment of mitotic entry in hours. Mitochondrial membrane potential was visualized after staining with 50 nM TMRE (red), active caspases 3/7 with caspases 3/7 detecting reagent (green), and nuclei with 200 nM Hoechst 33342(blue). The images were acquired using a Planapo ×63 oil immersion objective with NA = 1.46. Scale bar = 20 µm. (B) Threshold-dependent response of HeLa, HaCaT, U-118, PHF, A549, PC-3, and 3T3 cell lines after 72 h of treatment with 1–1000 nM doses of nocodazole, Taxol, and vinorelbine. From top to bottom cell lines are placed in order of decreasing sensitivity to death in mitosis. Threshold doses are indicated by empty (T1) and filled (T2) arrowheads. (C) Life histories of individual A549 cells treated with 30–1000 nM doses of nocodazole, Taxol, or vinorelbine. Each horizontal line represents a single cell. Numbers along the x-axis indicate the time from the moment addition of the drug in hours.

