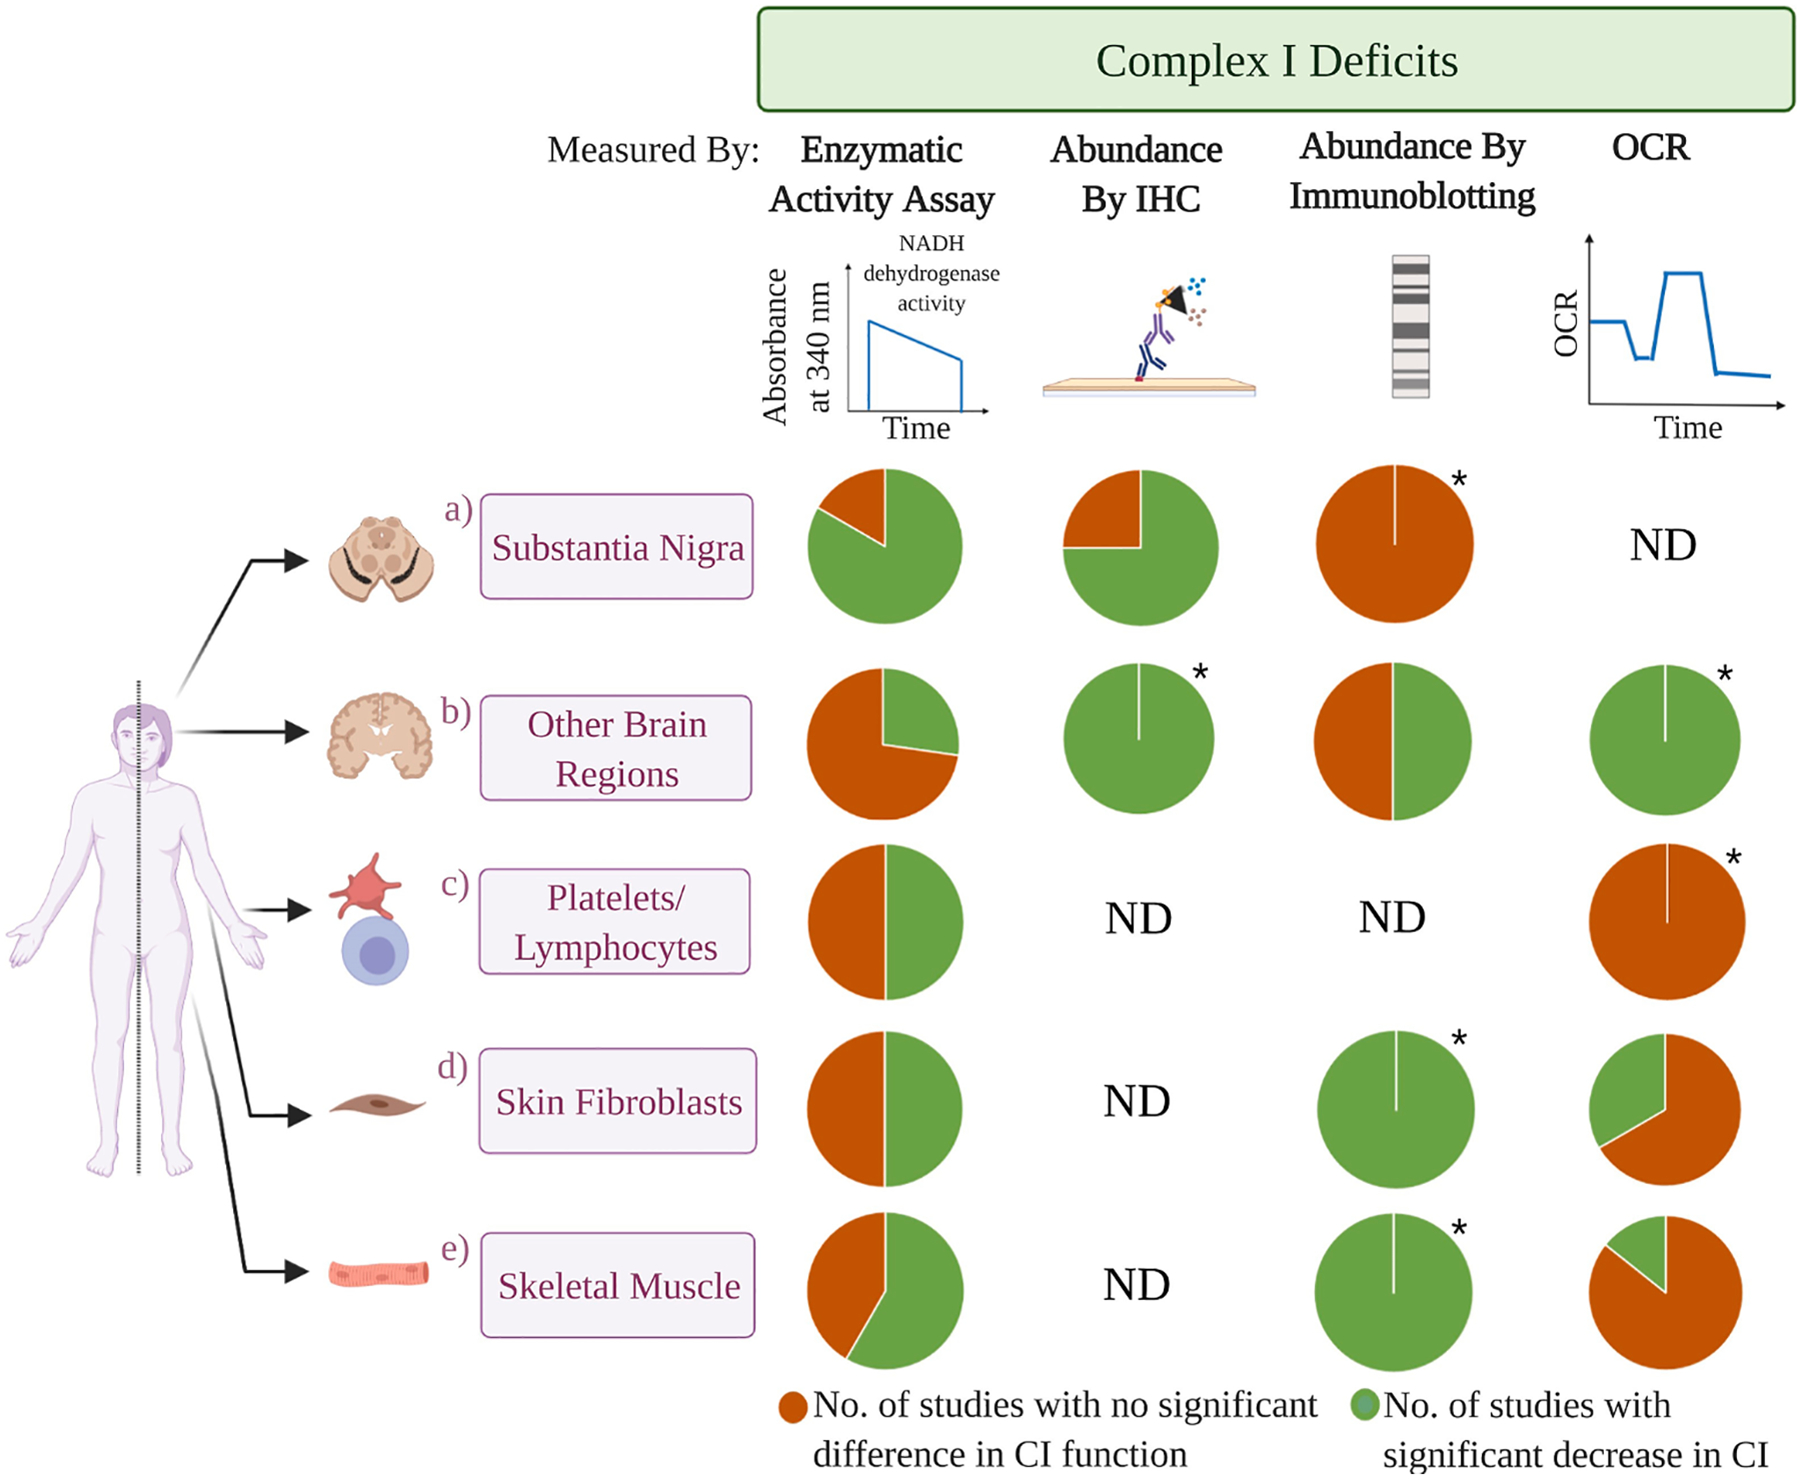
Fig. 1.

A lack of definitive CI deficiency in a majority of primary tissues from iPD patients. The pie charts represent the approximate percentage of independent studies that report a significant decrease in CI function (green) versus no significant differences (orange) in iPD patient tissues compared to the control subjects, or not determined (ND). Charts are segregated by tissue and assay method. The number of studies (CI-impairment vs no deficit) for a) SN, b) other brain regions, c) platelets/lymphocytes, d) skin fibroblasts, and e) skeletal muscle are as follows. CI enzymatic activities: a) 5 vs 1, b) 3 vs 8, c) 10 vs 10, d) 1 vs 1, e) 7 vs 5; immunohistochemistry: a) 3 vs 1, b) 1 vs 0, c) ND, d) ND, e) ND; SDS-PAGE/BN-PAGE immunoblotting: a) 0 vs 1, b) 2 vs 2, c) ND, d) 1 vs 0, e) 1 vs 0; CI-linked oxygen consumption rate (OCR): a) ND, b) 1 vs 0, c) 0 vs 1, d) 1 vs 2, e) 1 vs 6. The number of subjects tested in each study is highly variable and the details are provided in Tables 1 and 2. “ * ” indicates pie charts generated from only one available study. Created with Biorender.com.
