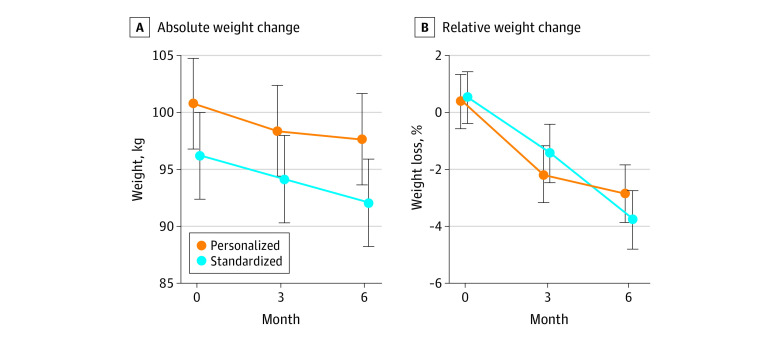
Figure 2. Body Weight Change Between Personalized and Standardized Arms.
Absolute and relative body weight change between participants randomized to the personalized group compared with the standardized group were assessed at baseline (0 months) and at 3 and 6 months. A, Data are reported as mean (95% CI). B, Estimates are from the linear mixed model and not the mean; therefore, the values are slightly different from 0.

