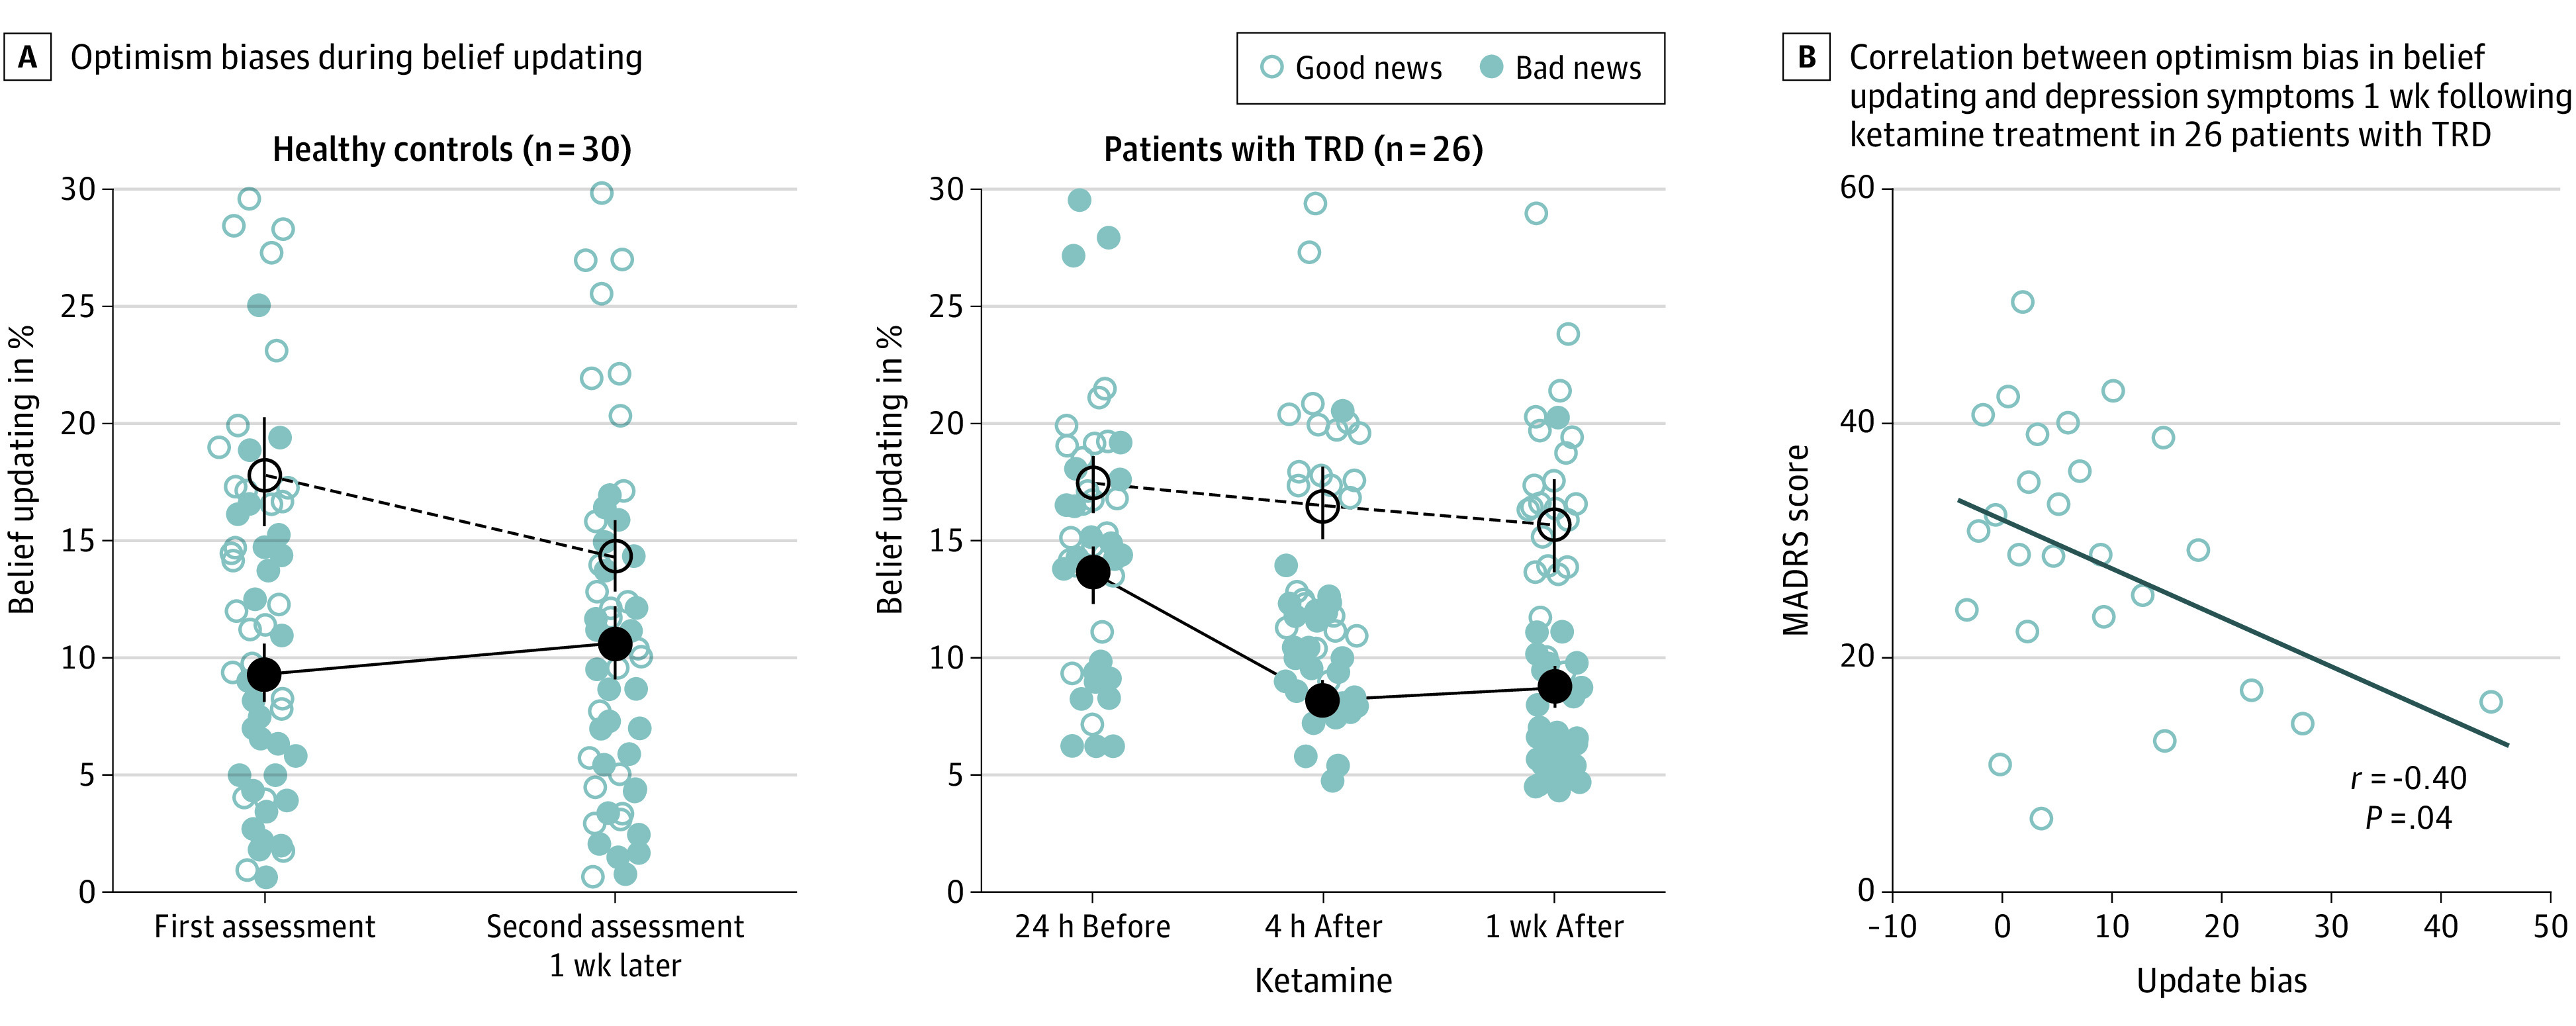
Figure 3. Behavioral Results for 26 Patients With Treatment-Resistant Depression (TRD) and 30 Healthy Controls.

A, The line graphs show the observed average belief updating after favorable (good) and unfavorable (bad) news. Belief updating corresponds to the absolute difference between the first and second estimate for good and bad news trials, respectively. Error bars correspond to the SE of the mean. B, Correlation between the depression score and belief updating for 26 patients with TRD after 1 week of ketamine treatment. The scatterplot displays the covariance of global clinical symptoms of depression (mean Montgomery-Åsberg Depression Rating Scale score) and good news/bad news updating bias.
