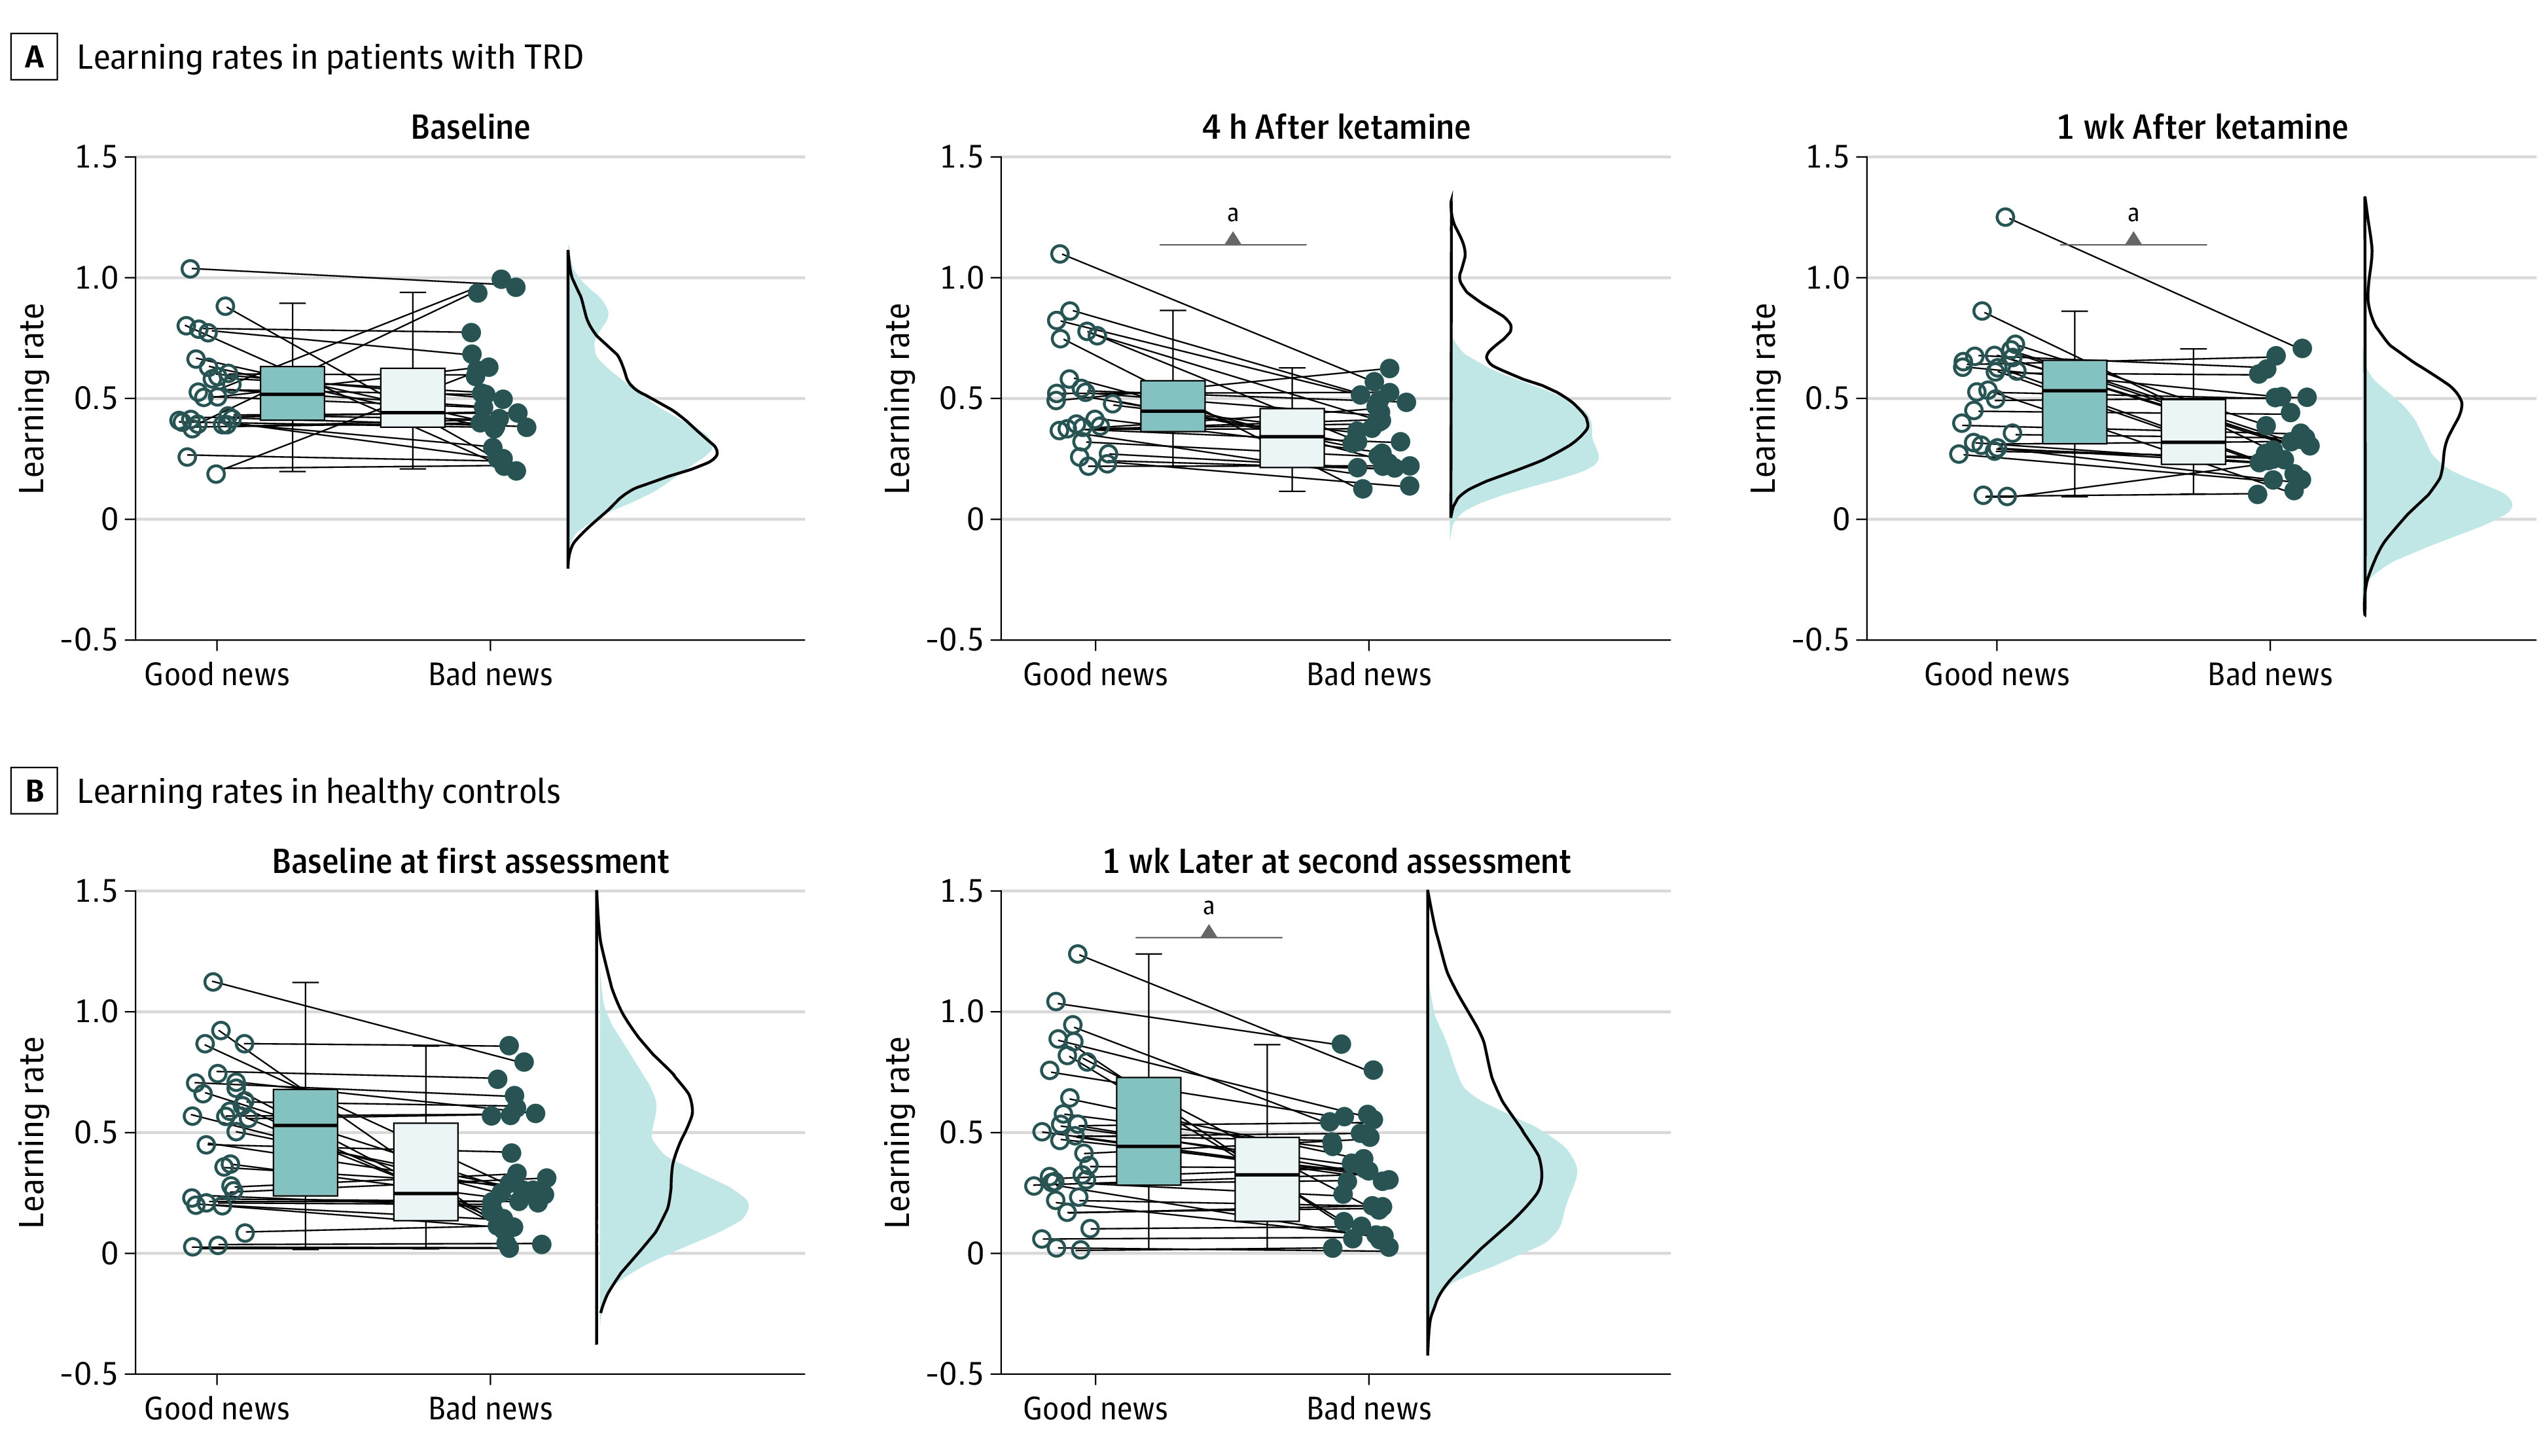
Figure 4. Model-Based Results.

Boxplot graphs showing the IQRs for learning rates obtained from fitting a generic reinforcement learning model to the observed belief updates in 26 patients with treatment-resistant depression (TRD) (A) and 30 healthy control participants (B). The jitter element to the side of each boxplot displays individual learning rates, with each dot representing 1 patient.
aP < .05.
