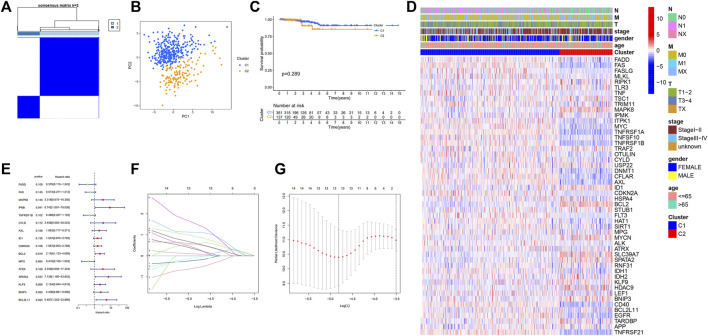
FIGURE 2.
Tumor classification based on the necroptosis-related DEGs; Univariate Cox regression analysis and LASSO analysis. (A) 498 PTC patients were grouped into two clusters according to the consensus clustering matrix (k = 2); (B) Principal Component Analysis (PCA) of RNA expression profile in TCGA cohort; (C) Kaplan–Meier curves of overall survival (OS) in two clusters; (D) Heatmap and clinicopathologic features of the two clusters; (E) Forest plot showing the result of univariate Cox regression analysis of OS, 16 genes with p < 0.2; (F) Cross-validation for tuning parameter selection in LASSO regression (G) LASSO analysis of 16 prognostic pyroptosis-related genes.

