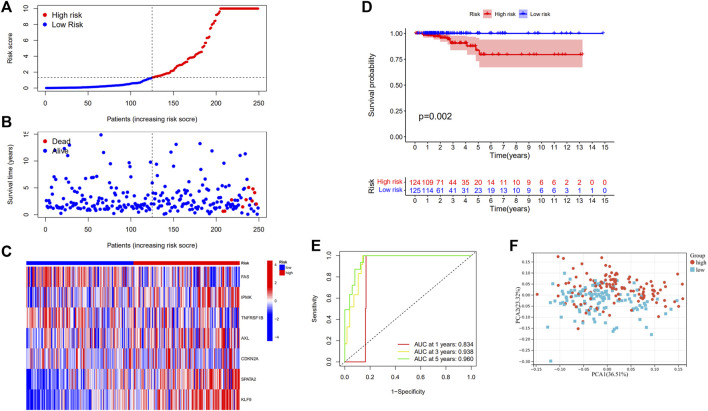
FIGURE 3.
Construction of risk signature in the train set (N = 249). (A) The distribution of risk score, (B) survival status, and (C) the expression of seven necroptosis-related genes in high- and low-risk groups; (D) Kaplan–Meier curves for OS of THCA patients in high- and low-risk groups; (E) Time-dependent ROC analysis, (F) PCA of TCGA cohort in the train set.

