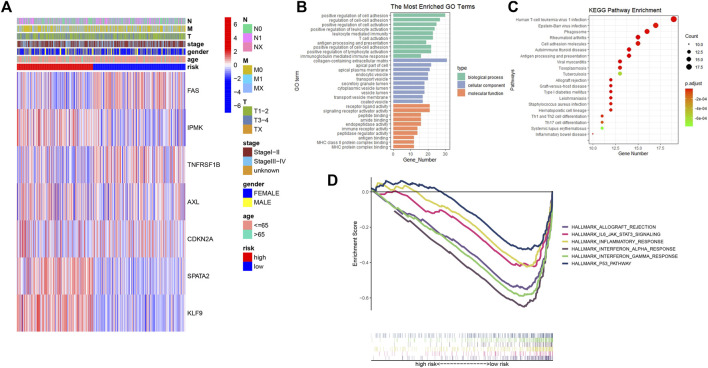
FIGURE 5.
(A) Heatmap showing the connections between clinicopathologic factors and high- and low-risk groups; (B) Bar chart for GO enrichment of DEGs between high- and low-risk; (C) Bubble graph for KEGG pathways of DEGs between high- and low-risk; (D) Gene set enrichment analysis (GSEA) showed the significantly enriched hallmarks of tumor sets based on the risk signature in TCGA.

