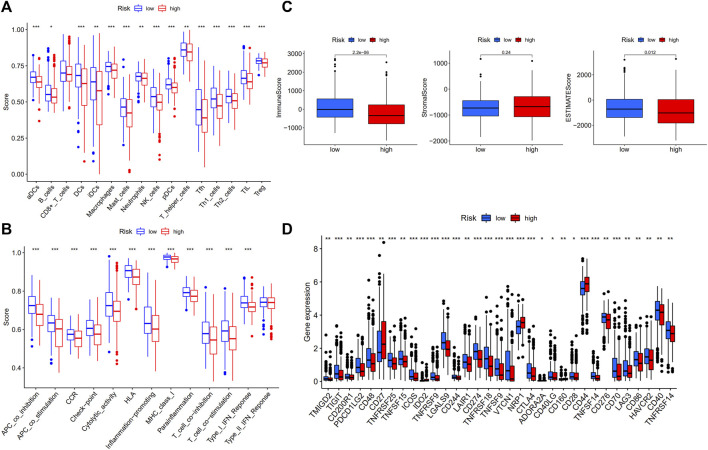
FIGURE 6.
Comparison of ssGSEA scores in high- and low-risk groups in TCGA-THCA database (N = 498). (A) 16 immune cells and (B) 13 immune-related functions between high- and low-risk groups; (C) The ESTIMATE scores of high- and low-risk groups; (D) Comparison of immune checkpoint expression between high- and low-risk groups.

