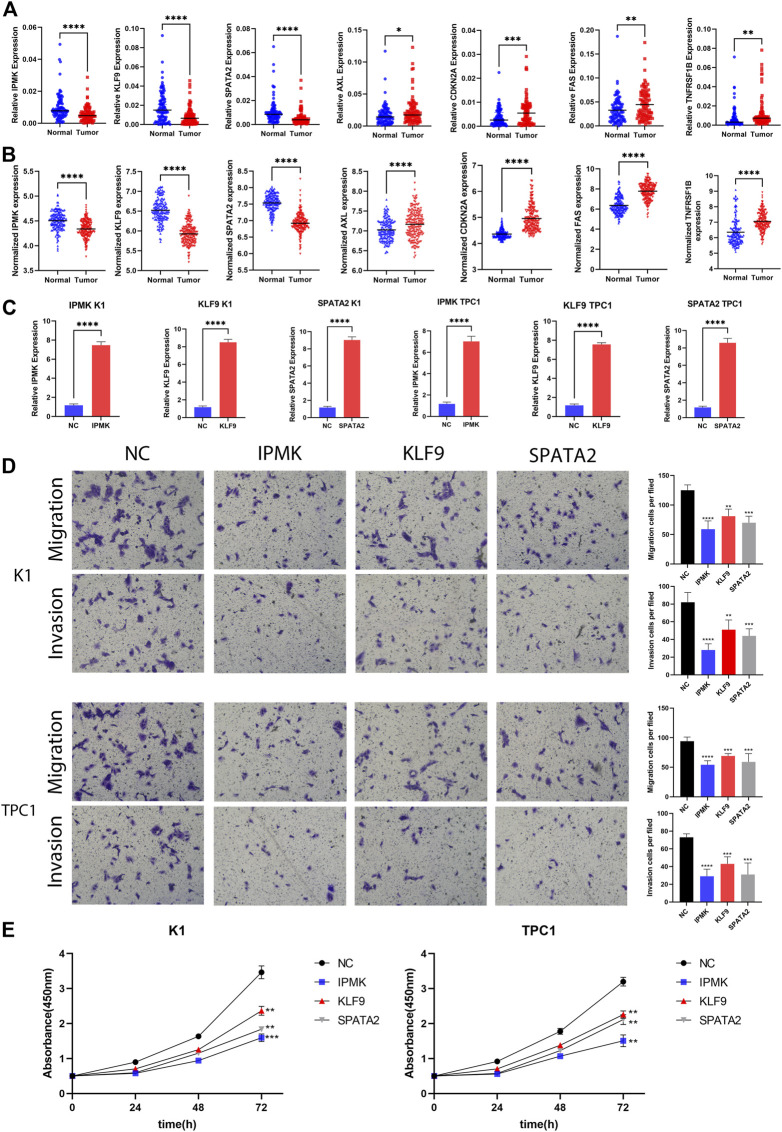
FIGURE 7.
Validation of gene expression and cell function assays. (A) The expression levels of IPMK, KLF9, SPATA2, AXL, CDKN2A, FAS, and TNFRSF1B quantified using qRT-PCR analysis in 96 paired thyroid cancer tissues and no-tumorous samples; (B) The expression levels of IPMK, KLF9, SPATA2, AXL, CDKN2A, FAS, and TNFRSF1B in GEO; (C) Expression level of IPMK, KLF9, and SPATA2 confirmed by qRT-PCR; (D) Transwell assays were used to evaluate the migration and invasion in PTC cells after IPMK or KLF9 or SPATA2 overexpression or NC; (E) CCK-8 assay was used to evaluate the proliferation after overexpression with the corresponding genes or NC in PTC cells. **p < 0.01; ***p < 0.001; ****p < 0.0001.

