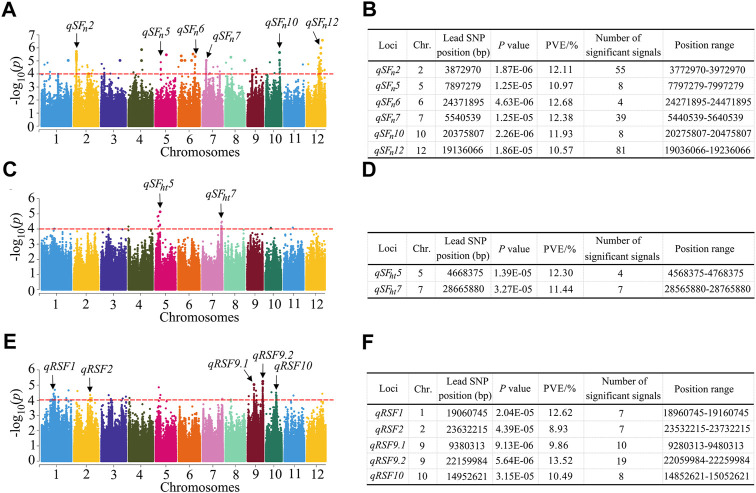
FIGURE 3.
Identification of QTLs by GWAS in rice. (A) Manhattan plots for SFn in the whole population of rice accessions. (B) Information of the identified QTL for SFn. (C) Manhattan plots for SFht in the whole population of rice accessions. (D) Information of the identified QTL for SFht. (E) Manhattan plots for RSF in the whole population of rice accessions. (F) Information of the identified QTL for RSF. Y axis means negative log10 transformed p-values and dots above the red line show the significant SNPs in the QTL region. The black arrows indicate the QTL identified. SFn, spikelet fertility in normal condition; SFht, spikelet fertility in high temperature condition; RSF, relative spikelet fertility. PVE: phenotypic variation explained.

