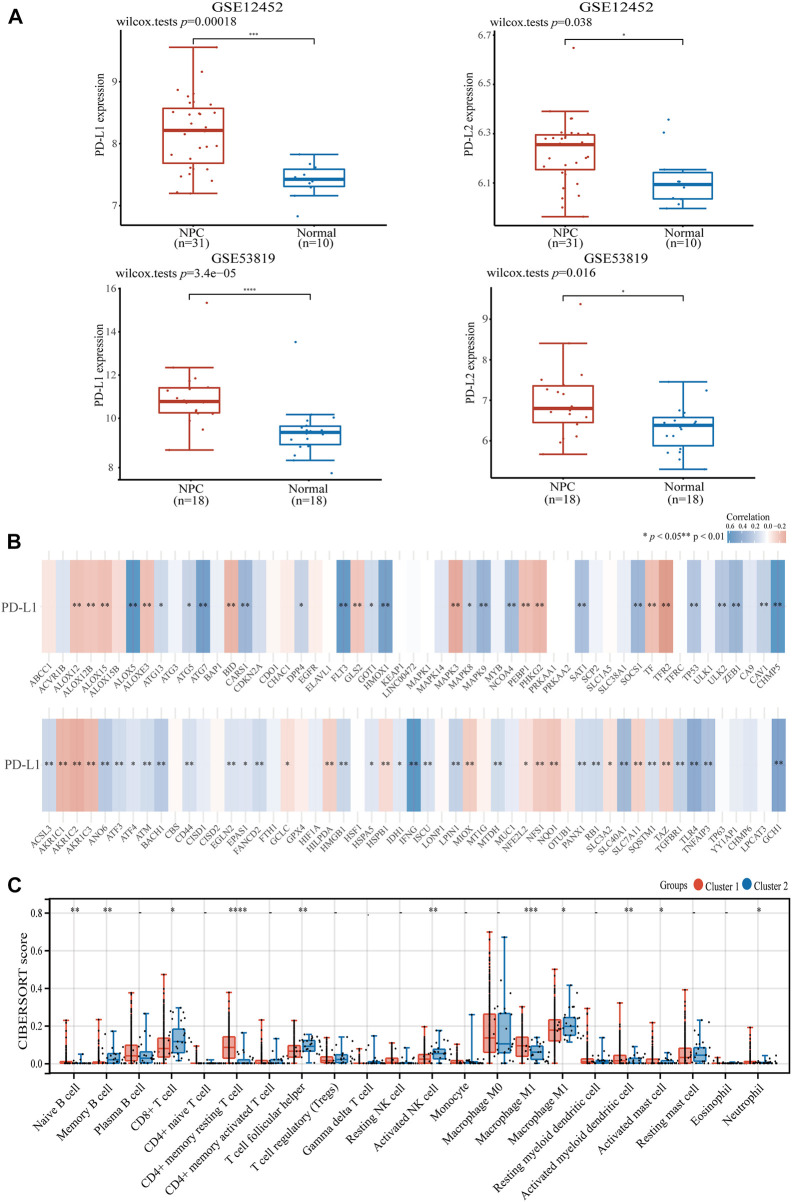
FIGURE 3.
The expression of PD-L1 and PD-L2 in HNSCC and NPC patients. (A) The expression of PD-L1/PD-L2 in NPC and normal samples base on GSE12452 and GSE53819 dataset. (B) The correlation of PD-L1 with ferroptosis-related genes in TCGA HNSCC dataset. (C) The expression distribution of CIBERSORT immune score in two clusters of HNSCC samples. *p < 0.05, **p < 0.01, ***p < 0.001.

