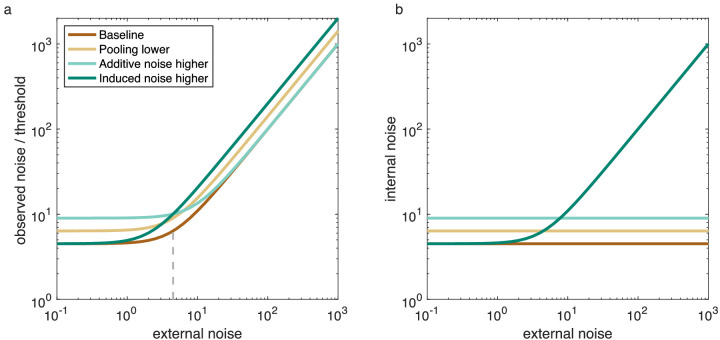
Figure 1.
(a) Modeled threshold versus external noise curves, as measured with equivalent noise paradigms. As external (stimulus) noise is increased, performance thresholds (i.e., observed noise) rise. When compared to a baseline (with a certain level of additive but no induced noise), the following effects are observed: Reducing motion pooling leads to a uniform upward shift in the curve; increasing additive noise increases thresholds but only at low levels of external noise; and induced noise increases thresholds, especially at high levels of external noise. The vertical dashed line identifies the elbow in the baseline curve and quantifies the level of additive noise according to the equivalent noise paradigm. (b) Internal noise versus external noise curves, as obtained with a double-pass paradigm. When expressed in terms of the total amount of internal noise, there are clear differences between the different manipulations. Increasing additive noise elevates the internal noise by the same amount independent of the external noise. When induced noise is included, internal noise shows a strong dependence on external noise. Induced noise is the only variable that causes an increase in internal noise in the internal versus external noise plot. In the original approach by Burgess and Colborne (1988), motion pooling was not taken into account. When using this approach, motion pooling scales the curve up or down equally at all external noise levels (causing misestimated noise levels, as shown in this figure). However, when explicitly including motion pooling in the model, motion pooling would have no effect on internal noise estimates (as per our method).

