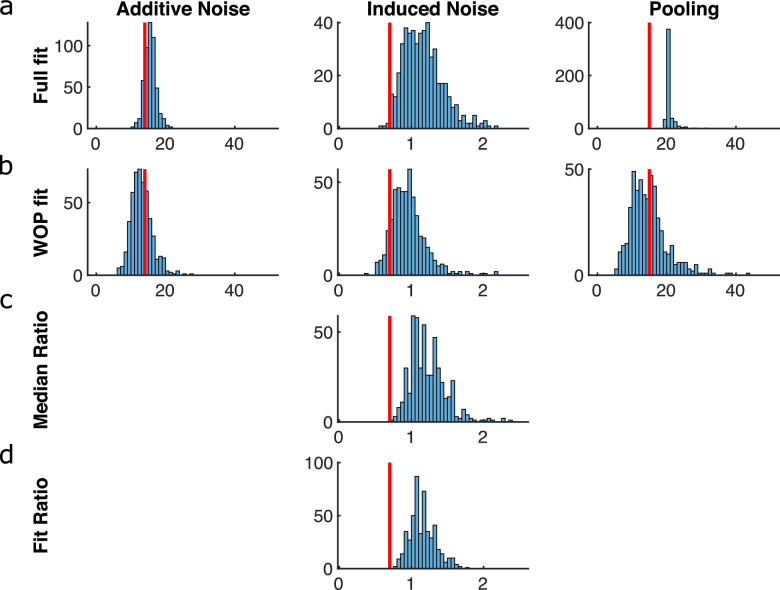
Figure 11.
Simulation results for different fitting procedures for the fine direction discrimination experiment. Results show histograms of estimated model parameters from 500 simulated runs. The red lines indicate the true values. (a) Full fit in which additive noise, induced noise, and motion pooling were all individually fit. (b) Fit without pooling (WOP) in which additive noise and induced noise were fitted, but the pooling parameter was estimated directly from the data. (c) Estimated induced noise, the median induced noise value for the five largest external noise conditions. (d) Estimated induced noise taken from a single fit through the five largest external noise conditions.

