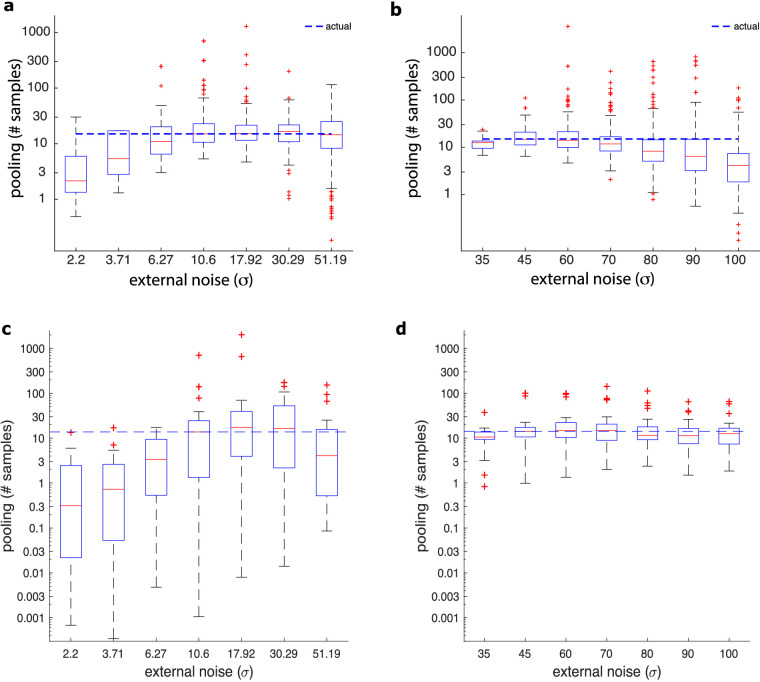
Figure 12.
Estimated motion pooling sample size. (a) Estimates based on Equation 2 from one of the simulations. Estimates for the fine direction discrimination task were accurate for larger external noise values used in the experiment. (b) Boxplots for the coarse direction discrimination task; these estimates were accurate for the lower external noise values used in the experiment. (c, d) Experimentally obtained motion pooling estimates for fine (c) and coarse (d) discrimination tasks. The box of the boxplots contains the 25th to 75th percentiles; the whiskers show the most extreme values not considered outliers, and the red markers show the outliers.

