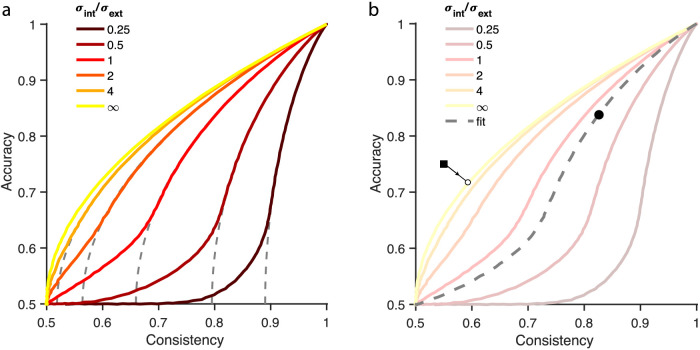
Figure 3.
Relationship between accuracy and consistency, dependent on different ratios of σint/σext. (a) Colored lines were calculated using a wrapped Gaussian distribution, and the dashed gray lines are based on Gaussian distributions used by Burgess and Colborne (1988). The line for σint/σext = ∞ is the case without external noise. (b) Schematic of how data were analyzed for two example data points. Internal noise for the data falling above the σint/σext = ∞ curve (e.g., square) was estimated by finding the nearest point on the σint/σext = ∞ curve, and the internal noise associated with that point was taken as the measured internal noise. For all other data (circle), the best fitting line determined σint/σext.

