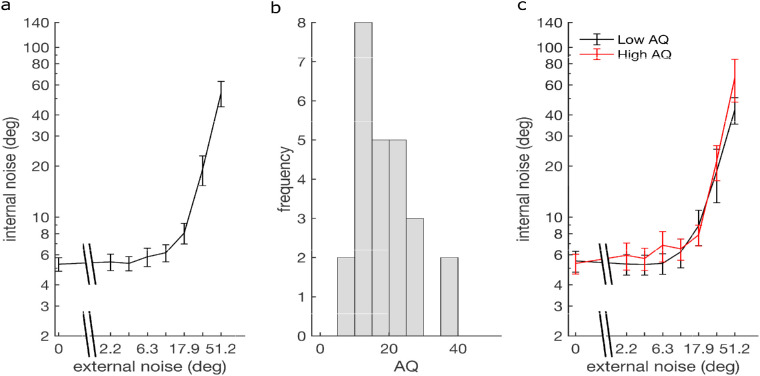
Figure 9.
(a) Dependence of mean (±SEM) internal noise on external noise for the fine discrimination task, averaged over participants. (b) Histogram depicting the distribution of AQ scores. (c) Internal noise after a median split for low- and high-AQ groups. Data points that were estimated as 0 internal noise were ignored.

