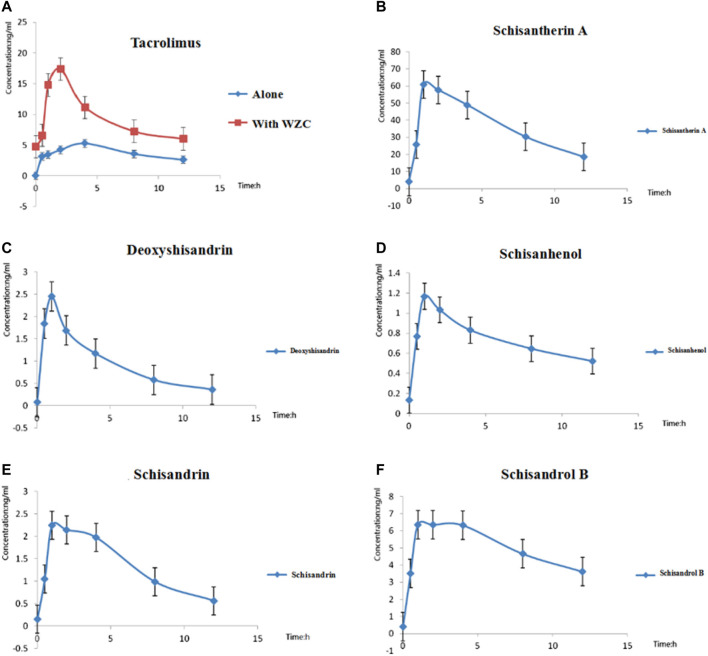
FIGURE 1.
The blood concentration vs. time curves of all the analytes. (A) Mean blood concentration–time curves of tacrolimus with or without WZC (n = 15); (B) Mean blood concentration–time curves of schisantherin A after oral administration of tacrolimus with WZC (n = 15); (C) Mean blood concentration–time curves of deoxyshisandrin after oral administration of tacrolimus with WZC (n = 15); (D) Mean blood concentration–time curves of schisanhenol after oral administration of tacrolimus with WZC (n = 15); (E) Mean blood concentration–time curves of schisandrin after oral administration of tacrolimus with WZC; (F) Mean blood concentration–time curves of schisandrol B after oral administration of tacrolimus with WZC (n = 15).

