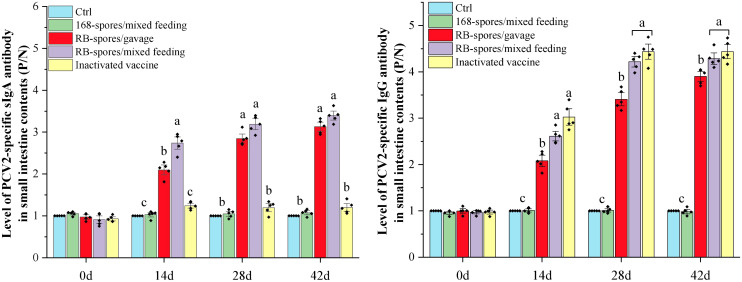
Figure 4.
Immune responses after immunizing mice with different methods. The levels of sIgA in the small intestinal contents and IgG levels in serum of experimental mice at 0d, 14d, 28d, and 42d were expressed as P/N values. Data were presented as mean ± standard deviation (n=5). One-way ANOVA followed by a Friedman test was performed, bars with different letters indicate significant difference (P < 0.05).

